What-If Analysis for
Incurred Cost Proposals

Model Rate Changes, Optimize Allocations, Justify Base Changes — All in Your Browser
Unlimited Scenarios
3
Base Types (CAS 410)
4
Statistical Methods
3+1
Side-by-Side Compare
01 — Why Scenario Modeling
Why Scenario Modeling Matters
Before you submit your incurred cost proposal, understand exactly how rate changes, cost reclassifications, and base selections will affect every pool, every rate, and every contract.

Rate Optimization

Model cost movements between OH, G&A, and intermediate pools to see rate impacts before submitting your proposal. Understand exactly how reclassifications affect your claimed rates.

CAS 410 Base Selection

Compare Total Cost Input (TCI), Value Added, and Single Element (Direct Labor) allocation bases with built-in CAS 410 compliance indicators and distortion warnings.

🎯

Target Rate Calculator

Set your desired rate and the tool reverse-solves for the exact pool or base amount required. Know precisely what dollar adjustment achieves your target overhead or G&A rate.

🔄

Impact Analysis

Simulate moving costs between pools and see cascading effects on the G&A base and all downstream rates. The tool respects base type when computing G&A impacts.

Base Change Justification

Four statistical methods support CAS 410-50(d) allocation base changes: OLS regression, rate impact analysis, sensitivity analysis, and an aggregated recommendation with confidence scoring.

📋

Scenario Comparison

Compare up to 3 scenarios against your baseline side-by-side with delta highlighting, G&A base breakdowns, and contract-level impact previews — all on one screen.

02 — Create & Manage
Create & Manage Scenarios
Build unlimited what-if scenarios from your live Schedule A data. Each scenario captures your current rates as a baseline, then lets you model changes independently.

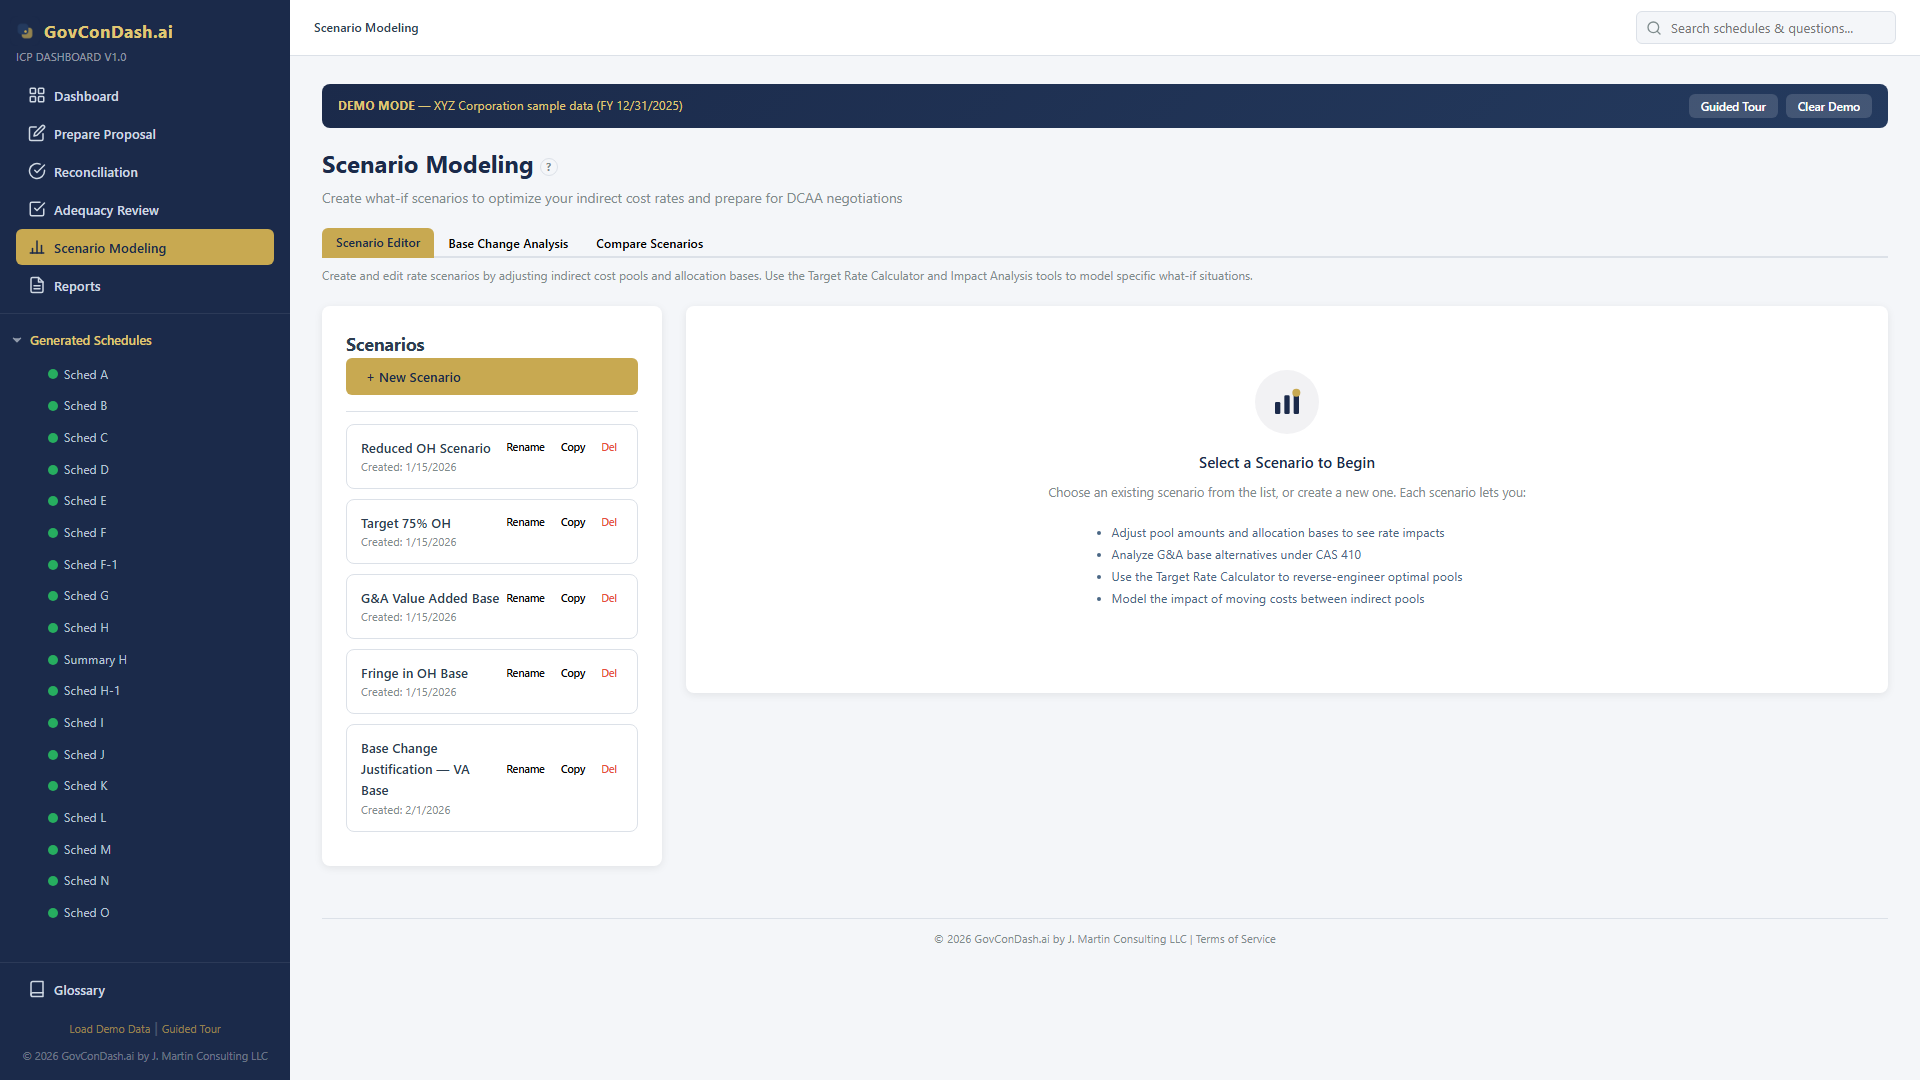
Scenario List & Organization

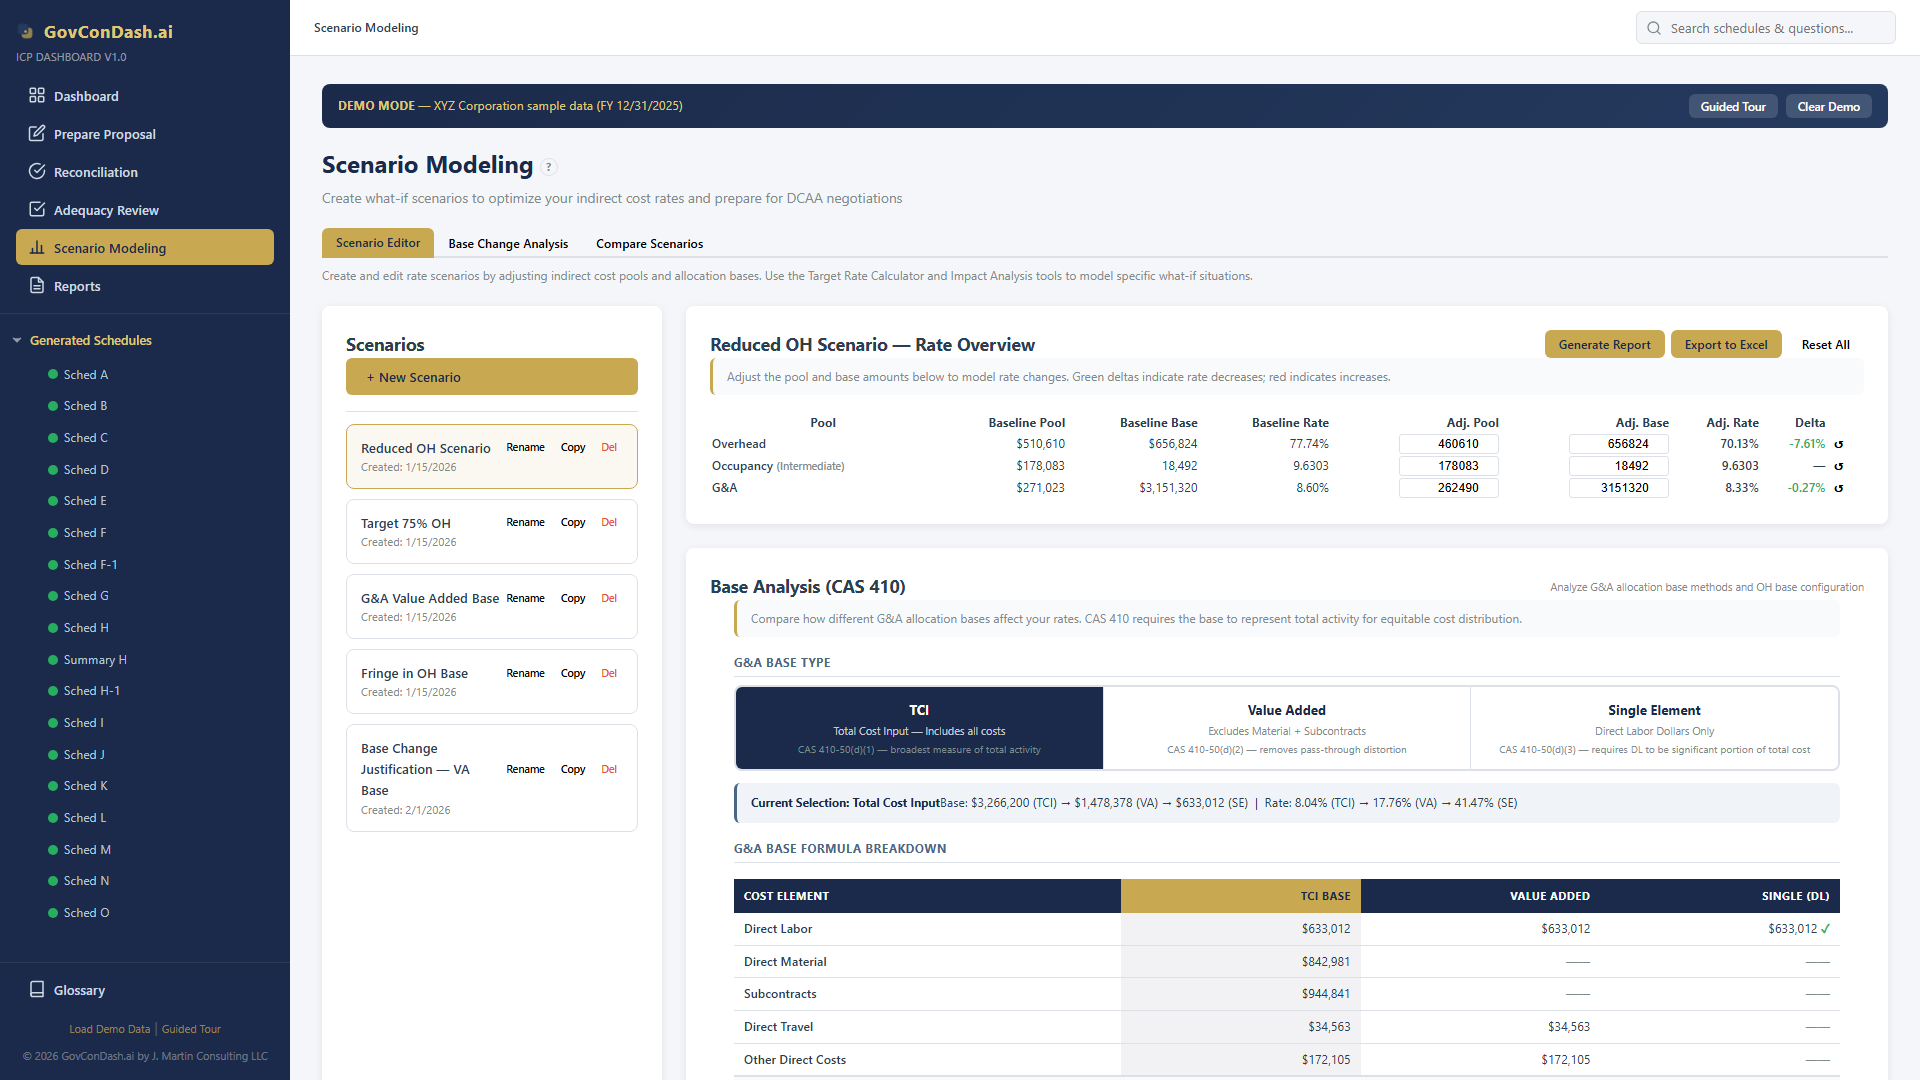
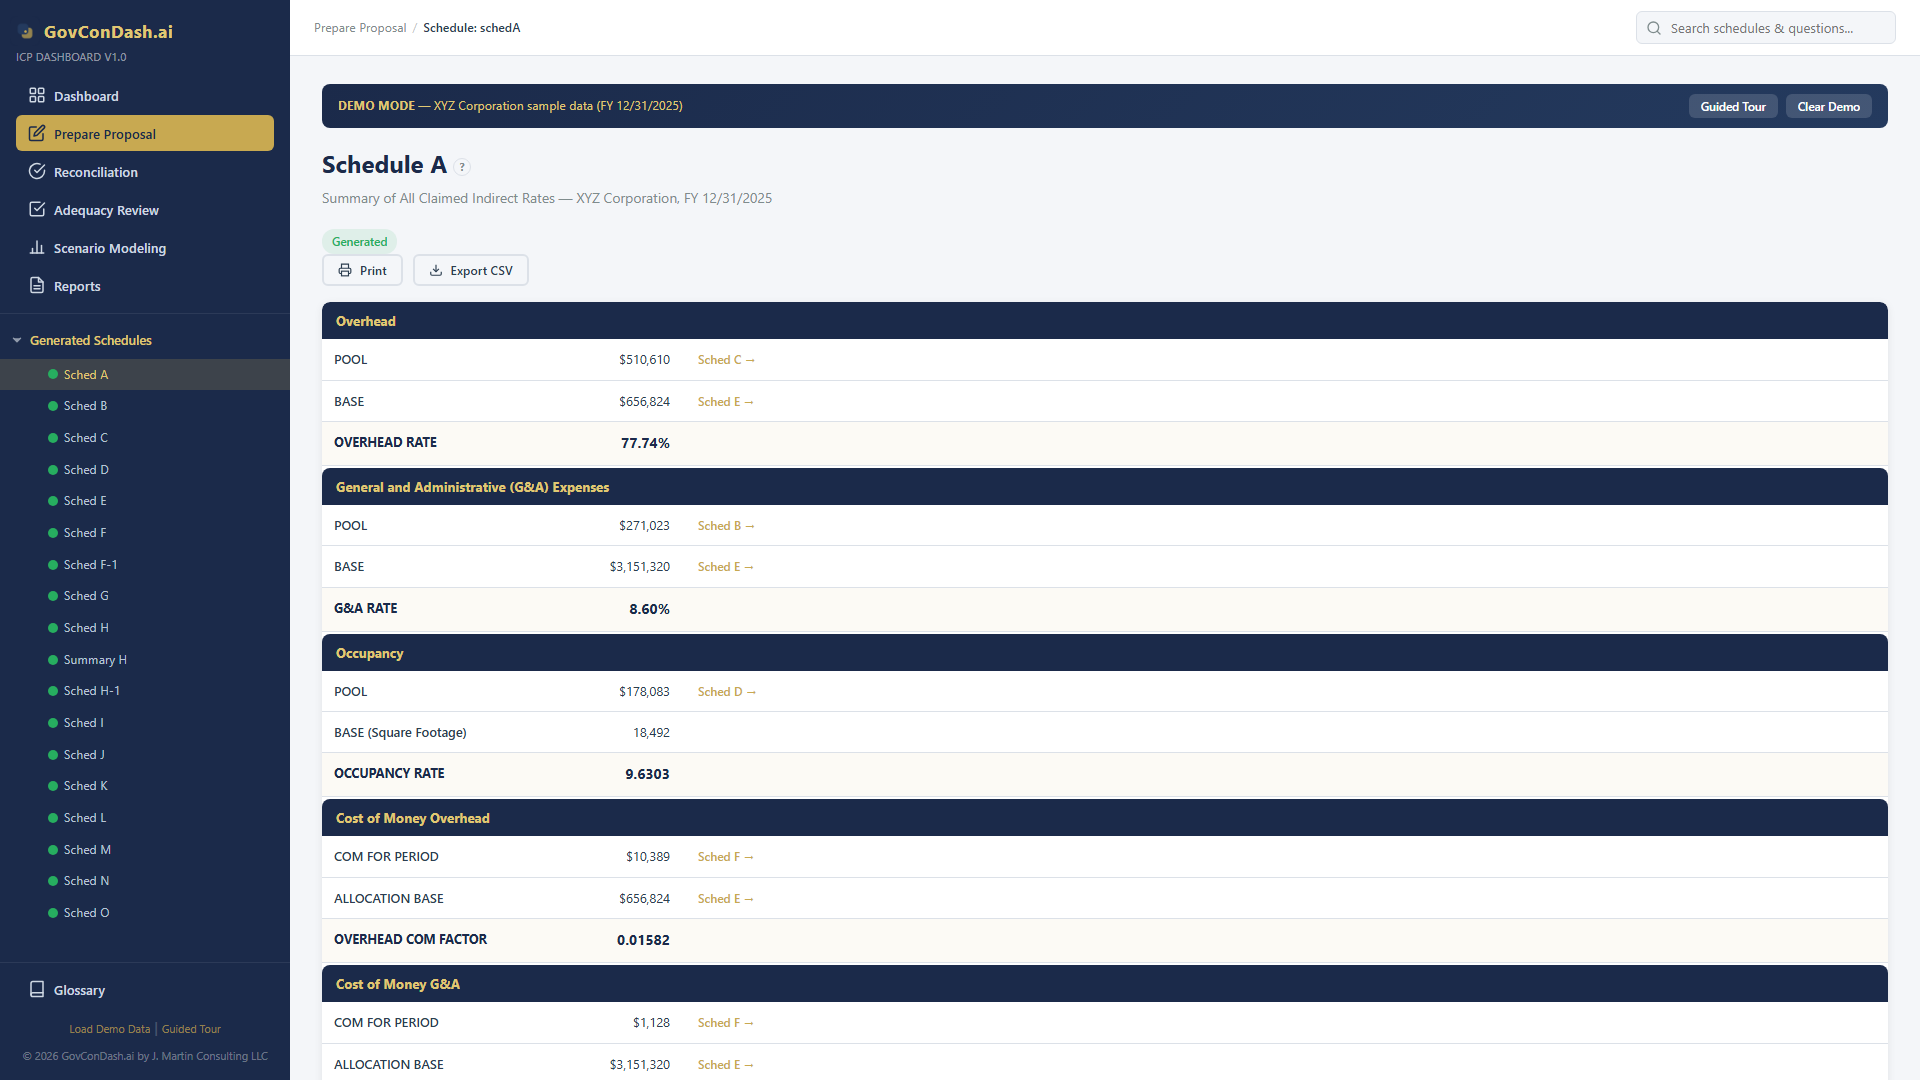
Every scenario starts by cloning the current rates and pools from your generated Schedule A. Name each scenario, track its creation date, and switch between them instantly. The dashboard maintains both the original baseline and your modified computed state, so you always know what changed.

  • Clone from Live Schedule A — Each scenario captures your current OH pools, G&A pool, fringe rate, COM factors, and cost breakdown as a baseline snapshot
  • Unlimited Scenarios with Full CRUD — Create, rename, duplicate, and delete scenarios freely. There is no limit on how many you can model
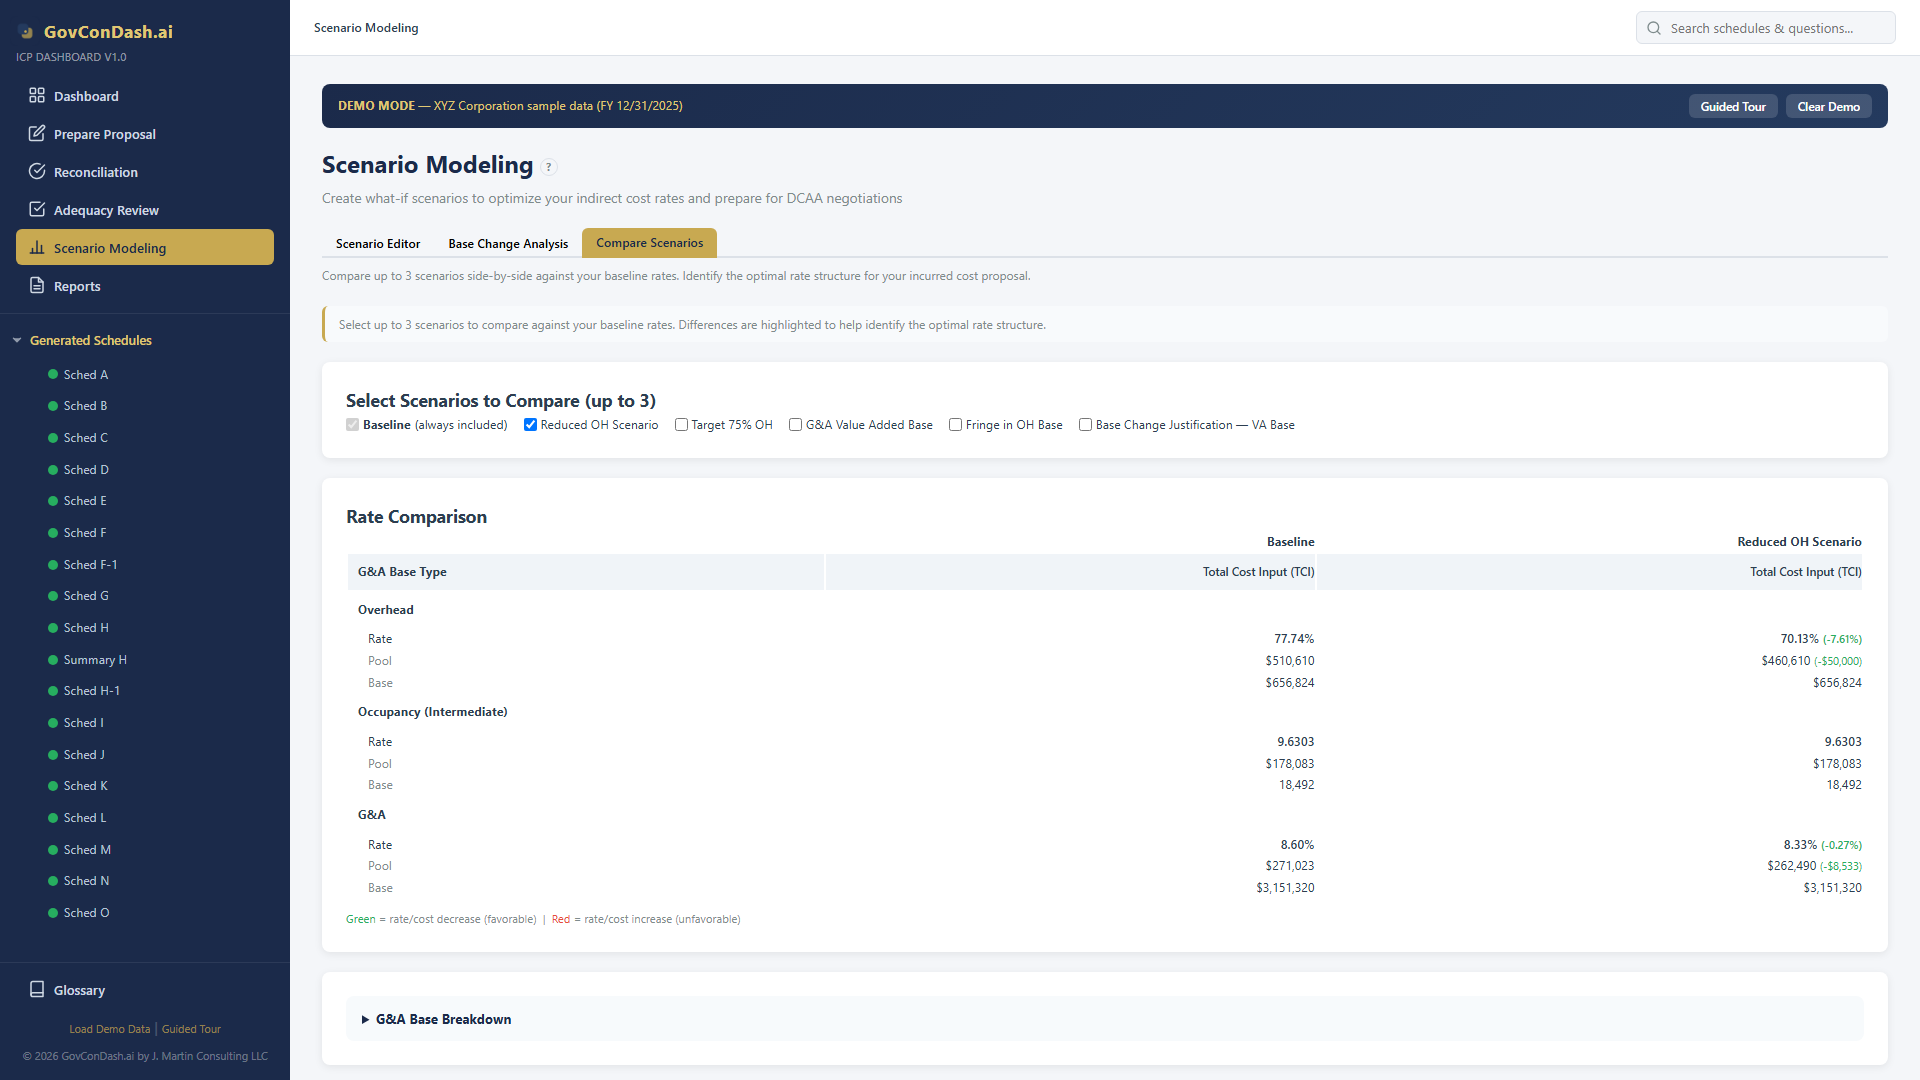
  • Baseline vs. Computed State — Every scenario tracks both its original baseline and the computed state after your adjustments, enabling clear delta analysis
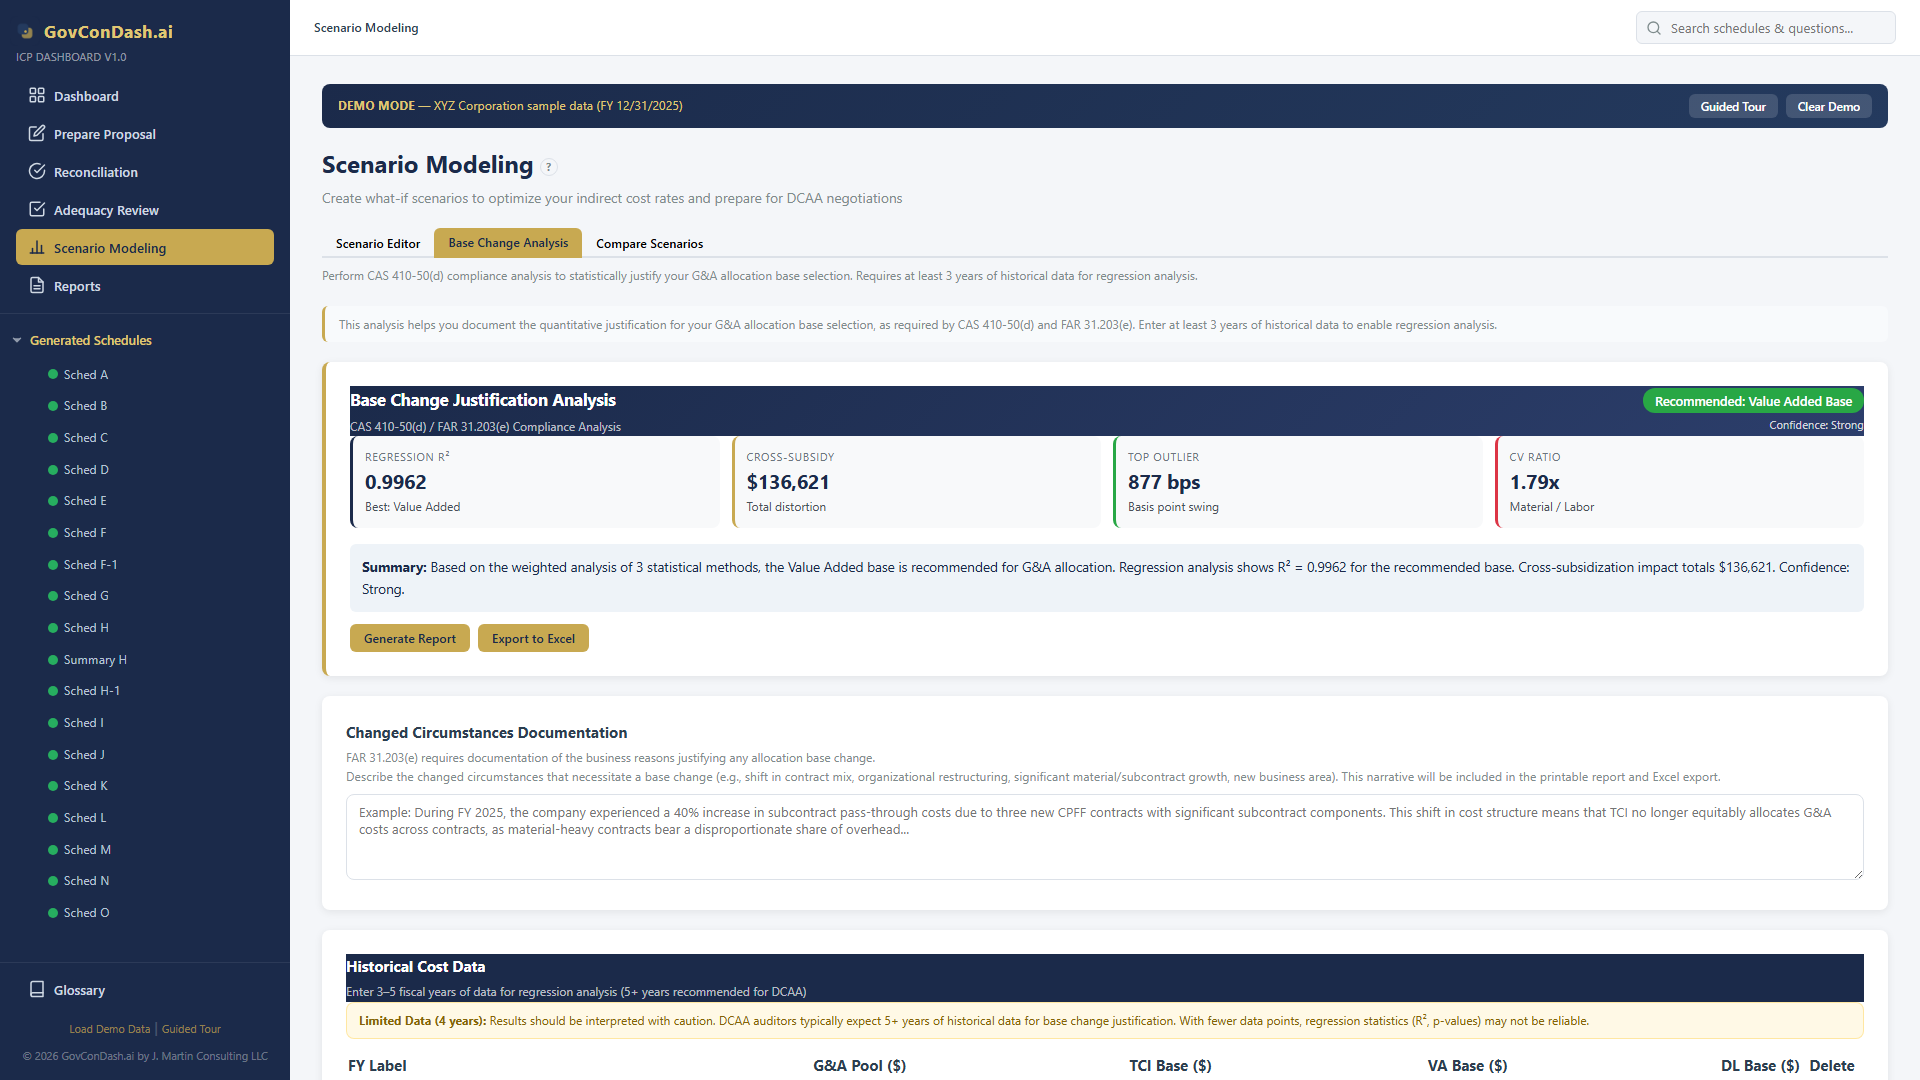
  • 5 Pre-Built Demo Scenarios — Load the demo data to explore pre-configured scenarios including Reduced OH, Target 75% OH, Value Added Base, Fringe in OH Base, and Base Change Justification
Scenario list with 5 pre-built scenarios
Scenario list showing 5 pre-built demo scenarios with creation dates

Editable Rate Table

The scenario editor presents an interactive rate table where you can directly modify pool amounts, base amounts, and rate configurations. Changes recalculate instantly, showing you the new rates alongside the baseline for immediate comparison.

  • Direct Pool Editing — Adjust OH pool amounts, G&A pool totals, and fringe pools directly in the table. Rates recompute in real time
  • Rate Precision — Rates display at 4-decimal precision for indirect rates and 5-decimal precision for CAS 414 Cost of Money factors, matching ICE Model standards
  • Instant Recalculation — Every edit triggers lightweight rate recalculation without running the full schedule generation pipeline
  • Baseline Comparison Column — See your original baseline rate alongside the computed rate after adjustments, with delta values highlighted
Scenario editor with editable rate table
Scenario editor with editable rate table and real-time recalculation
03 — CAS 410 Compliance
CAS 410 Base Analysis
CAS 410 governs how contractors allocate G&A expenses. The dashboard lets you model all three allocation base types side-by-side with compliance indicators, formula breakdowns, and distortion warnings.

Three G&A Allocation Base Types

The Base Analysis card provides a comprehensive comparison of Total Cost Input, Value Added, and Single Element allocation methods. Each method computes the G&A base differently, directly affecting your G&A rate and how costs are distributed across contracts.

  • Total Cost Input (TCI) — The most inclusive base: all direct costs plus fringe, overhead, and intermediate allocations. Used by most contractors as the default CAS 410 method
  • Value Added — Excludes direct material and subcontracts from the base, reducing distortion for material-heavy contractors where pass-through costs would inflate G&A allocations
  • Single Element / Direct Labor — The simplest base, using only direct labor dollars. Must pass the CAS 410-50(d)(3) insignificance test to demonstrate that the single element represents total activity
  • Formula Breakdown Table — All three methods displayed side-by-side with line-item calculations showing exactly how each base is computed from your cost data
Base Analysis CAS 410 card
CAS 410 Base Analysis card with three allocation methods compared

Baseline Rates Feed Into Scenarios

Every scenario begins with rates generated from your actual proposal data — Schedule A serves as the source of truth. The rate summary shows OH, G&A, intermediate, and COM rates that become the baseline for all what-if modeling.

  • Schedule A as Baseline — Your generated Schedule A (Master Rate Summary) provides the starting pool amounts, base amounts, and computed rates for every new scenario
  • OH Rate Configuration — Toggle fringe-in-OH-base to see how including fringe benefits in the overhead base changes the OH rate and downstream allocations
  • CAS 410 Compliance Indicators — Built-in warnings flag when a base selection may not meet CAS 410-50(d) requirements, such as the insignificance test for single element bases
  • FAR 31.203 Anti-Fragmentation — Guidance on FAR 31.203 anti-fragmentation rules helps ensure your allocation method does not create unwarranted cost concentrations
Schedule A rate summary
Schedule A rate summary — baseline rates that feed into scenario modeling
04 — Calculators
Target Rate & Impact Analysis
Two powerful calculators that answer the questions every contractor asks: "What adjustment do I need to hit my target rate?" and "What happens if I move costs between pools?"

Target Rate Calculator

Set your desired rate — for example, 75% overhead — and the calculator reverse-solves for the exact pool or base amount needed to achieve it. No more trial and error with spreadsheet formulas.

  • Solve for Pool Amount — Given your target rate and current base, the tool computes the exact pool amount required: Pool = Rate × Base
  • Solve for Base Amount — Given your target rate and current pool, the tool computes the required base: Base = Pool ÷ Rate
  • One-Click Apply — Apply the calculator result directly to your scenario with a single click, automatically updating the computed state and all downstream rates
  • Exact Dollar Adjustment — See the precise dollar difference between your current pool/base and the target, so you know exactly how much cost to reclassify
Target rate calculator
Target Rate Calculator — reverse-solve for desired OH or G&A rates

Impact Analysis

Simulate moving a dollar amount from one pool to another and instantly see the cascading effects across all rates. The analysis respects your G&A base type, so TCI and Value Added scenarios produce different downstream impacts.

  • Cost Movement Simulation — Specify an amount, a source pool, and a destination pool. The tool computes new rates for both pools plus all affected downstream rates
  • Cascading G&A Base Effects — When costs move into or out of OH, the G&A base (under TCI) changes too, creating a cascading effect on the G&A rate that the tool captures automatically
  • Base-Type-Aware — The analysis respects your scenario's base type: TCI cascades differ from Value Added cascades, and Single Element bases have no cascade effect
  • One-Click Apply — Apply the impact analysis result directly to your scenario, updating pool amounts and rates across the board
Impact analysis
Impact Analysis — simulate cost movements between pools with cascading effects
05 — Statistical Justification
Base Change Justification
When changing your G&A allocation base (for example, from TCI to Value Added), DCAA requires statistical and contractual justification per CAS 410-50(d) and FAR 31.203(e). The dashboard provides four analytical methods to build your case.

Four Analytical Methods

The Base Change Analysis tab runs four independent analyses across your historical fiscal year data. Each method examines the relationship between G&A costs and each allocation base type, producing quantitative evidence for your recommended base.

  • Multi-Year OLS Regression — Ordinary Least Squares regression across TCI, Value Added, and Direct Labor bases. Produces R², adjusted R², p-values, t-statistics, standard errors, and confidence intervals for each base type
  • Per-Contract Rate Impact — Computes G&A allocation for every contract under each base type. Identifies cross-subsidization amounts and flags contracts exceeding CAS 410-50(d)(3) thresholds
  • Sensitivity & Outlier Analysis — Pareto distribution of material and subcontract concentration, Herfindahl index for cost diversity, coefficient of variation comparison, and rate stability ranking
  • Overall Recommendation — Aggregates all four methods into a voting system with confidence level (Strong, Moderate, or Weak) and a clear base recommendation with regulatory citations
Base change analysis tab
Base Change Analysis tab with historical data and four analytical methods

Regression Scatter Plots

Visualize the statistical relationship between your G&A pool and each allocation base across multiple fiscal years. The scatter plots include OLS trend lines, confidence bands, outlier detection, and R² annotations to make the analysis accessible and audit-ready.

  • Three Scatter Plots — One for each base type (TCI, Value Added, Direct Labor) plotted against the G&A pool, with data points for each historical fiscal year
  • OLS Trend Lines — Best-fit regression lines showing the linear relationship between the base and the G&A pool, with slope and intercept values
  • Confidence Bands — Visual confidence intervals around the trend line showing the range of expected values at each base level
  • Outlier Detection — Data points exceeding 2x the standard error are flagged as potential outliers, helping you identify anomalous fiscal years that may skew the analysis
Regression scatter plots
Scatter plots with OLS trend lines, confidence bands, and R² annotations
06 — Compare
Scenario Comparison
Select up to 3 scenarios and compare them against your baseline in a single side-by-side view. Delta highlighting makes rate changes instantly visible, and contract-level impact previews show the dollar effects of each scenario.

Side-by-Side Comparison

The comparison view displays your baseline rates alongside up to 3 selected scenarios in a structured table. Every pool, rate, and base amount is shown with delta values highlighted in color, making it easy to see which scenario produces the most favorable rate structure.

  • Delta Highlighting — Rate increases and decreases are color-coded at a glance, so you immediately see which pools are affected and by how much in each scenario
  • Base Type Differences — When scenarios use different G&A base types (TCI vs. Value Added vs. Direct Labor), the comparison table highlights the base type row so reviewers understand the structural difference
  • G&A Base Breakdown — Each scenario shows its G&A base composition, including which cost elements are included or excluded under its base type configuration
  • Contract-Level Impact Preview — See how each scenario's rate changes would affect dollar allocations at the contract level, helping you understand the real-world impact on individual contracts
Side-by-side scenario comparison
Side-by-side comparison of up to 3 scenarios with baseline and delta highlighting
07 — Real-World Applications
Real-World Use Cases
The demo data includes 5 pre-built scenarios that illustrate practical applications of scenario modeling. Here are four common situations where what-if analysis changes the conversation with your auditor.
Scenario 1

Reduced OH Scenario

Move $50,000 from the OH pool to G&A. See the OH rate drop from 77.74% while the G&A rate increases to absorb the reclassified costs. Understand the tradeoff between pool rates before making the adjustment in your actual proposal.

Key Insight: Reclassifying costs between pools is not zero-sum. The cascading effect on the G&A base means the net impact depends on your base type.
Scenario 2

Target 75% OH Rate

Your current OH rate is 77.74%. Use the Target Rate Calculator to find the exact pool adjustment needed to bring it down to 75%. The tool computes that you need to reduce the OH pool by a specific dollar amount or increase the OH base accordingly.

Key Insight: The Target Rate Calculator eliminates trial-and-error. Set your desired rate and get the exact dollar figure in one step.
Scenario 3

G&A Value Added Base

Switch the G&A allocation base from TCI to Value Added per CAS 410. By excluding material and subcontract costs from the base, the G&A rate increases (from 8.60% under TCI) but applies to a smaller base, reducing distortion for material-heavy contracts.

Key Insight: Value Added bases prevent large pass-through costs from absorbing disproportionate G&A, a common issue for contractors with significant subcontract activity.
Scenario 4

Base Change Justification

Run OLS regression analysis across 4 fiscal years of historical data. Value Added shows R² greater than 0.92 — the strongest statistical fit among all three base types. TCI shows lower R² (~0.70-0.80), supporting the case for a base change to Value Added.

Key Insight: DCAA expects quantitative evidence for base changes. A higher R² demonstrates that the proposed base better explains the variability in G&A costs across fiscal years.

Model Your Rates with Confidence

Stop guessing how cost reclassifications and base changes will affect your proposal. Build scenarios, run the numbers, compare results, and submit with confidence — all from your browser.

GovConDash.ai