Complete guide to what-if rate analysis, CAS 410 base evaluation, and indirect rate optimization in the ICP Dashboard
The Scenario Modeling module lets you create “what-if” copies of your indirect rate structure and explore changes safely. Every adjustment is sandboxed — your actual incurred cost data in the Prepare Proposal wizard and generated schedules remain untouched until you decide to act.
Use scenario modeling to answer questions like: “What happens to our OH rate if we reclassify $50K from overhead to G&A?” or “Should we switch our G&A base from TCI to Value Added under CAS 410?”
Edit pool amounts and allocation bases directly. Rates recalculate instantly with color-coded delta indicators.
Compare TCI, Value Added, and Single Element G&A bases side-by-side with formula breakdowns and compliance guidance.
Reverse-solve: given a desired rate, find the pool or base amount needed to achieve it.
Simulate moving costs between pools and see cascading effects on all rates, including G&A base adjustments.
Four statistical methods (regression, rate impact, sensitivity, outlier) to justify CAS 410-50(d) base changes.
Compare up to 3 scenarios against your baseline in a side-by-side rate table with delta highlighting.
The Scenario Modeling interface showing pre-built demo scenarios
Click the Scenario Modeling button in the left sidebar. It’s located below the Adequacy Review section with a bar-chart icon.
If you have no scenarios yet, you’ll see a welcome card explaining the benefits of scenario modeling. If your schedules are generated, a “Create Your First Scenario” button appears. If not, you’ll see a note to generate schedules first.
Welcome state before any scenarios are created
Each scenario card in the list panel shows the scenario name, creation date, and three action buttons:
When you select a scenario, the right panel displays the Rate Overview card. This is your primary workspace for adjusting indirect rates.
The table has these columns:
| Column | Description |
|---|---|
| Pool | Name of the indirect cost pool (e.g., General Overhead, G&A) |
| Baseline Pool $ | Original pool amount from your generated Schedule A (read-only) |
| Baseline Base $ | Original allocation base amount (read-only) |
| Baseline Rate | Original rate = Pool / Base (read-only) |
| Adj. Pool $ | Editable — type a new pool amount to model changes |
| Adj. Base $ | Editable — type a new base amount to model changes |
| Adj. Rate | Auto-computed from adjusted pool / adjusted base (4 decimal places) |
| Delta | Difference between adjusted and baseline rates, color-coded |
| Reset | Circular arrow icon to restore that pool to its baseline values |
The scenario editor with Rate Overview table showing baseline and adjusted columns
Click on any Adj. Pool or Adj. Base input field and type a new dollar amount. The rate recalculates instantly.
Deltas are color-coded to quickly identify favorable vs. unfavorable changes:
Rate deltas highlighted after pool adjustment — green for decreases, red for increases
Three buttons appear in the Rate Overview header: Generate Report (printable analysis), Export to Excel (multi-sheet workbook), and Reset All (restore baseline).
CAS 410 (Allocation of Business Unit General and Administrative Expenses to Final Cost Objectives) governs how you select and apply your G&A allocation base. The choice of base type directly impacts which contracts bear more or less G&A expense. The Base Analysis card in the scenario editor lets you model all three options.
Includes all direct costs + fringe + overhead + intermediate. The broadest measure of total activity and the default safe choice for most contractors.
Excludes direct material and subcontracts from the base. Use when pass-through costs distort G&A allocation across contracts with varying material/sub levels.
Uses direct labor dollars only. Must demonstrate that labor is a significant portion of total costs. Requires strong justification.
Scroll down from the Rate Overview to the Base Analysis (CAS 410) card. Click one of the three base type option cards. The selected card highlights with a gold border, and all rates recalculate using the new base.
CAS 410 base analysis showing three base type options and formula breakdown
Below the base type cards, a detailed table shows which cost elements are included or excluded under each method. The currently selected base type column is highlighted. Excluded items show an em-dash (—). The bottom rows show the resulting G&A base, G&A pool, and G&A rate under each option.
Value Added base type selected with formula breakdown across all three methods
The “Include Fringe in OH Base” checkbox controls whether fringe benefit costs are added to the overhead pool’s allocation base. When toggled, the OH base and rate recalculate immediately. An impact label shows the dollar amount added or removed from the base.
At the bottom of the Base Analysis card, an expandable Optimization Insights panel provides comprehensive FAR and CAS guidance organized into six sections: FAR 31.203 indirect cost rules, CAS 410 compliance notes, when to consider Value Added, rate optimization spectrum, tactical solutions, and implications of changes.
Expanded Optimization Insights panel with FAR/CAS reference guidance
Target Rate Calculator interface with pool selector, rate input, and solve-for options
Calculator result showing required pool amount to achieve target rate, with delta from current
Impact Analysis interface with amount, source pool, and destination pool inputs
This is a critical concept. When your G&A base type is TCI or Value Added, the overhead pool amount is a component of the G&A allocation base. So moving costs into or out of an OH pool changes not just the OH rate, but also the G&A base — and therefore the G&A rate.
The Impact Analysis tool automatically calculates these cascading effects and displays them in the results table. A note indicates the G&A base adjustment amount.
Impact analysis result showing before/after rates with cascading G&A base effects
If you determine that a different G&A base type would be more equitable, you need documented evidence to justify the change to your DCAA auditor and Administrative Contracting Officer (ACO). The Base Change Analysis tab provides a comprehensive analytical framework with four complementary methods.
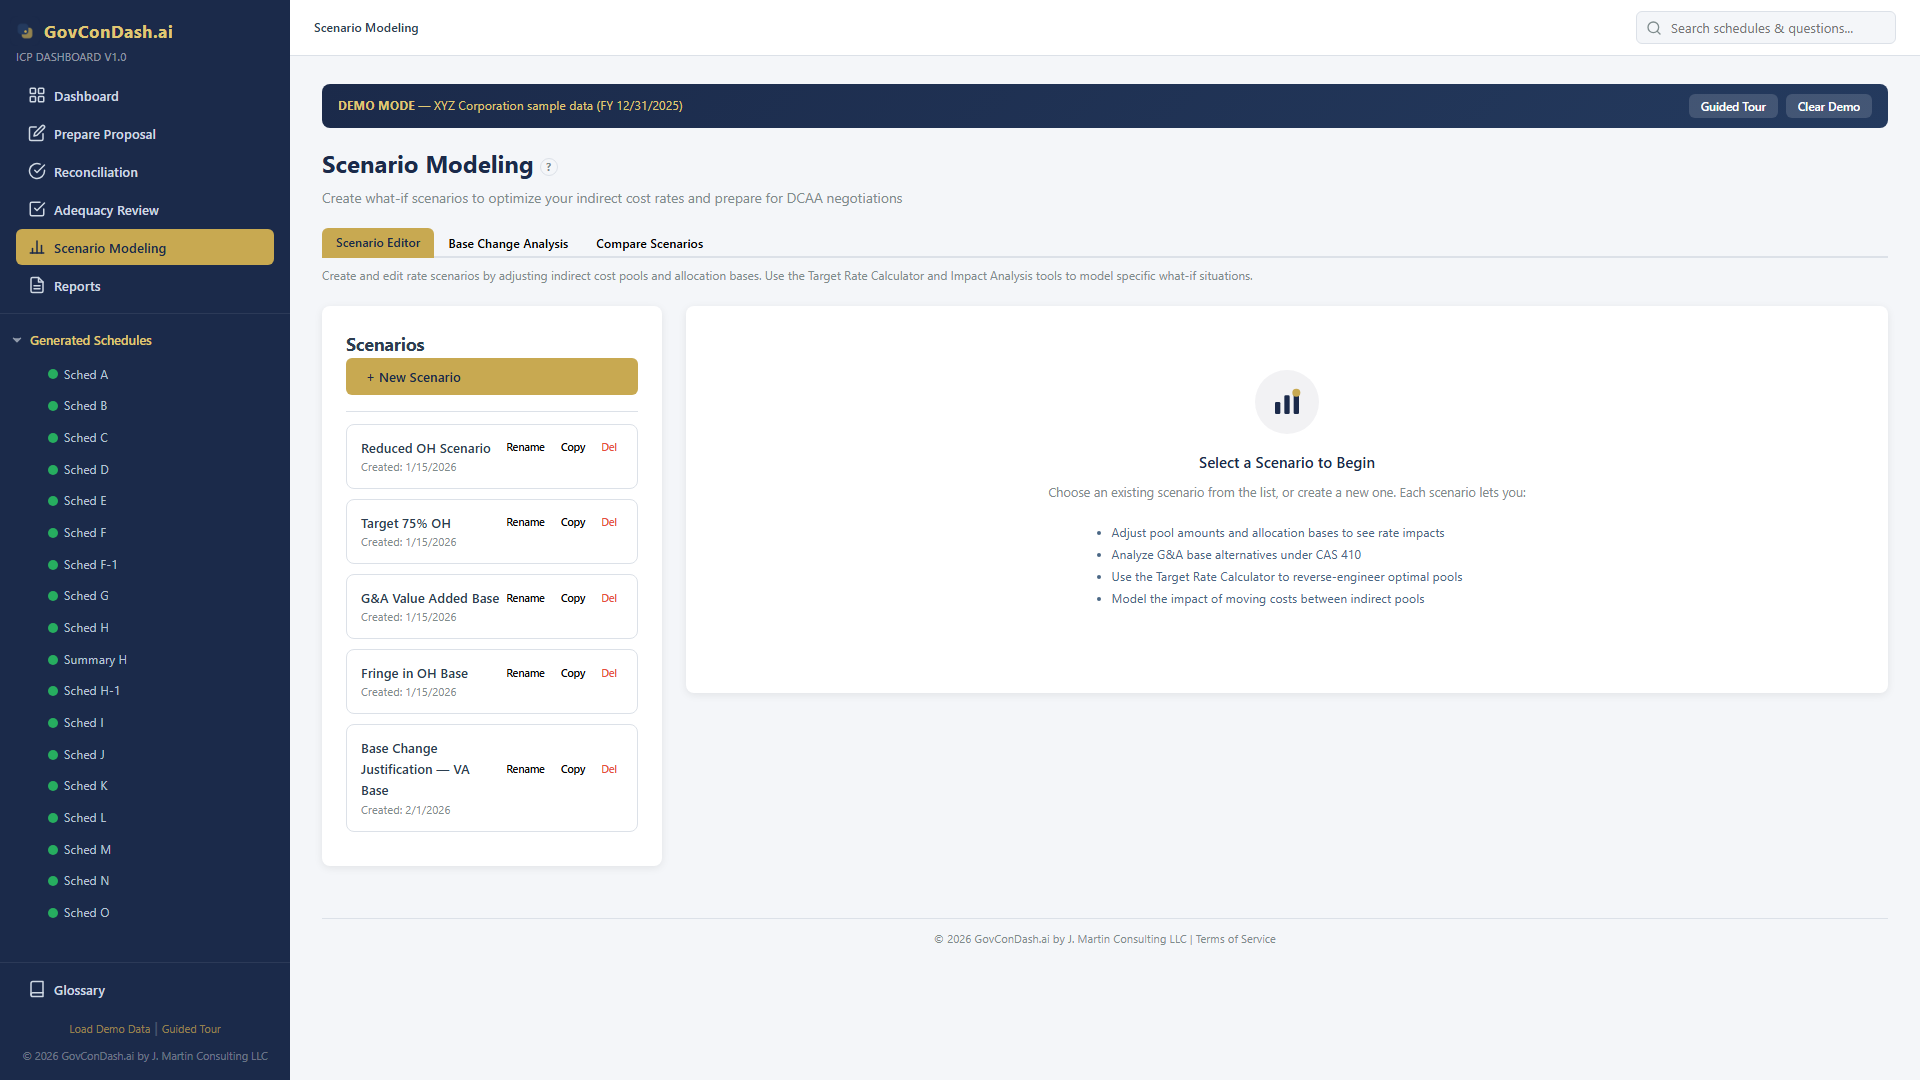
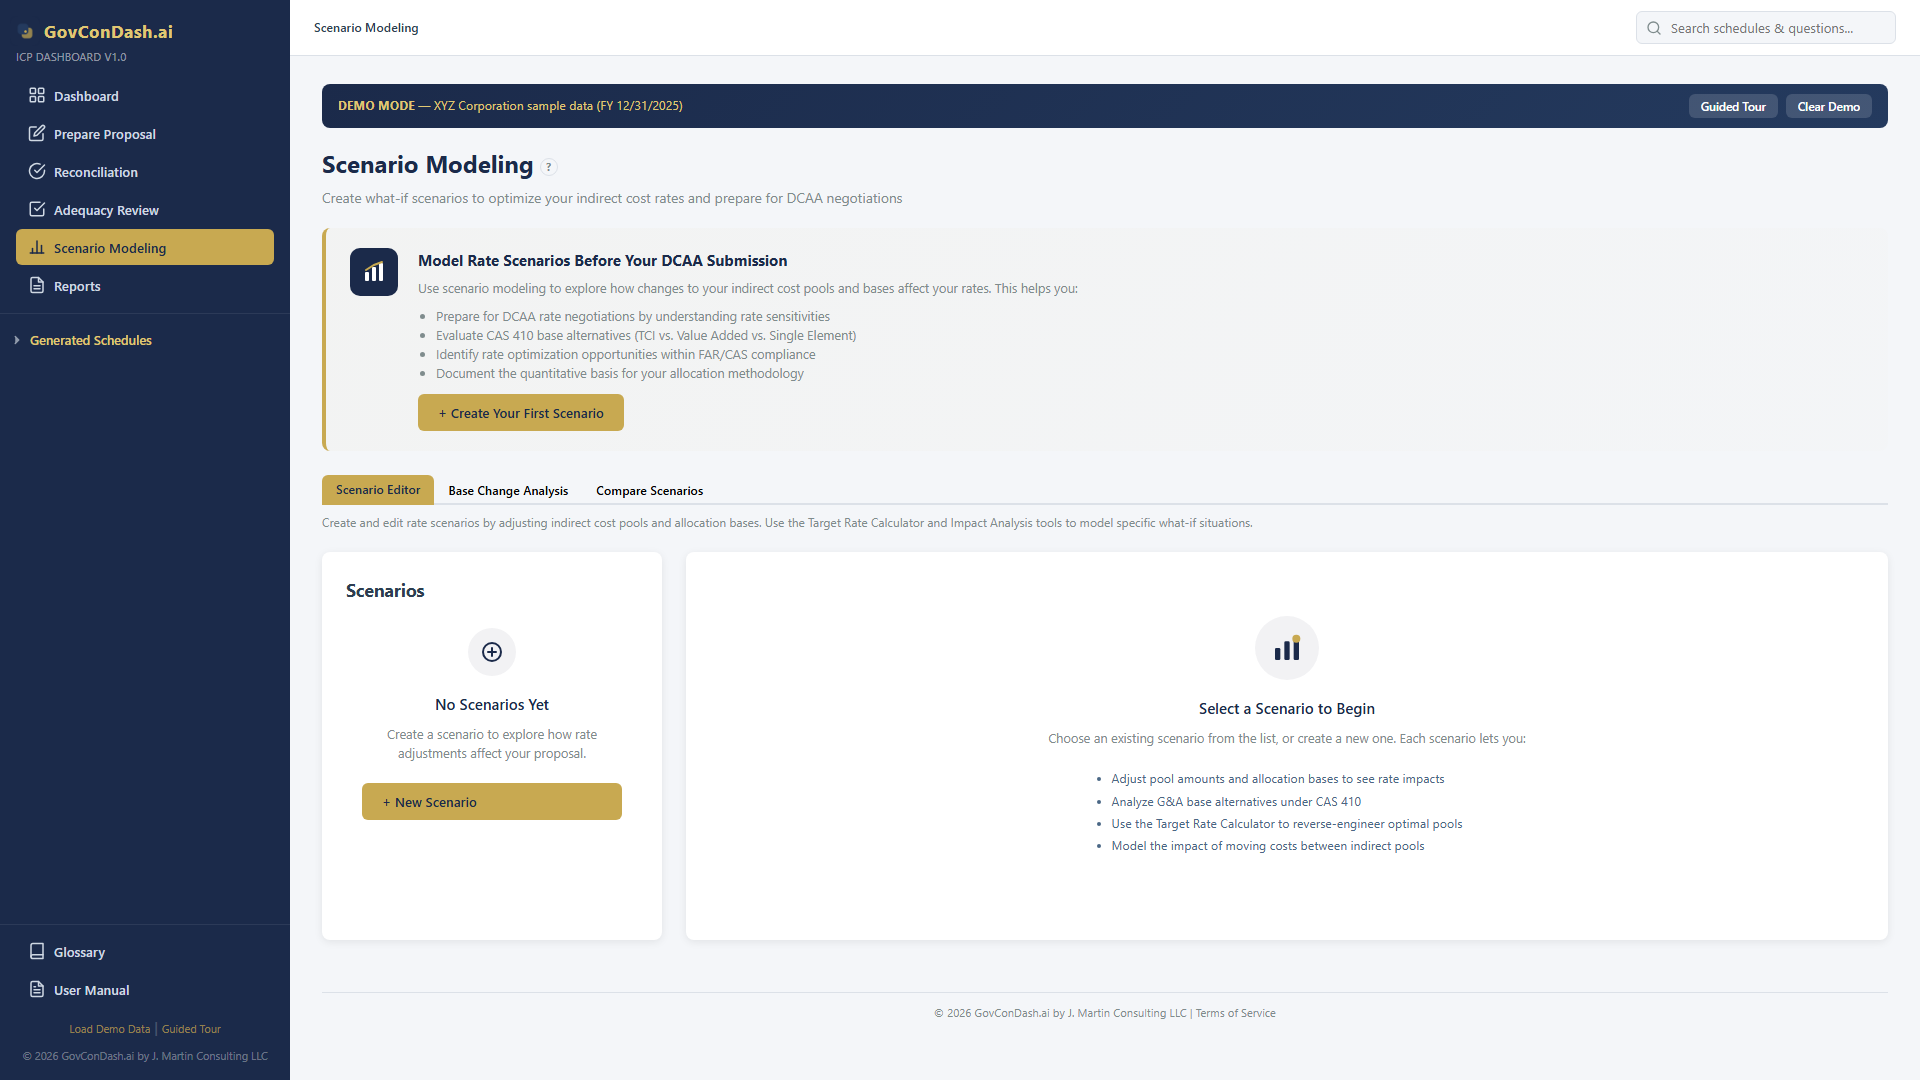
Access it by clicking the “Base Change Analysis” tab at the top of the Scenario Modeling page.
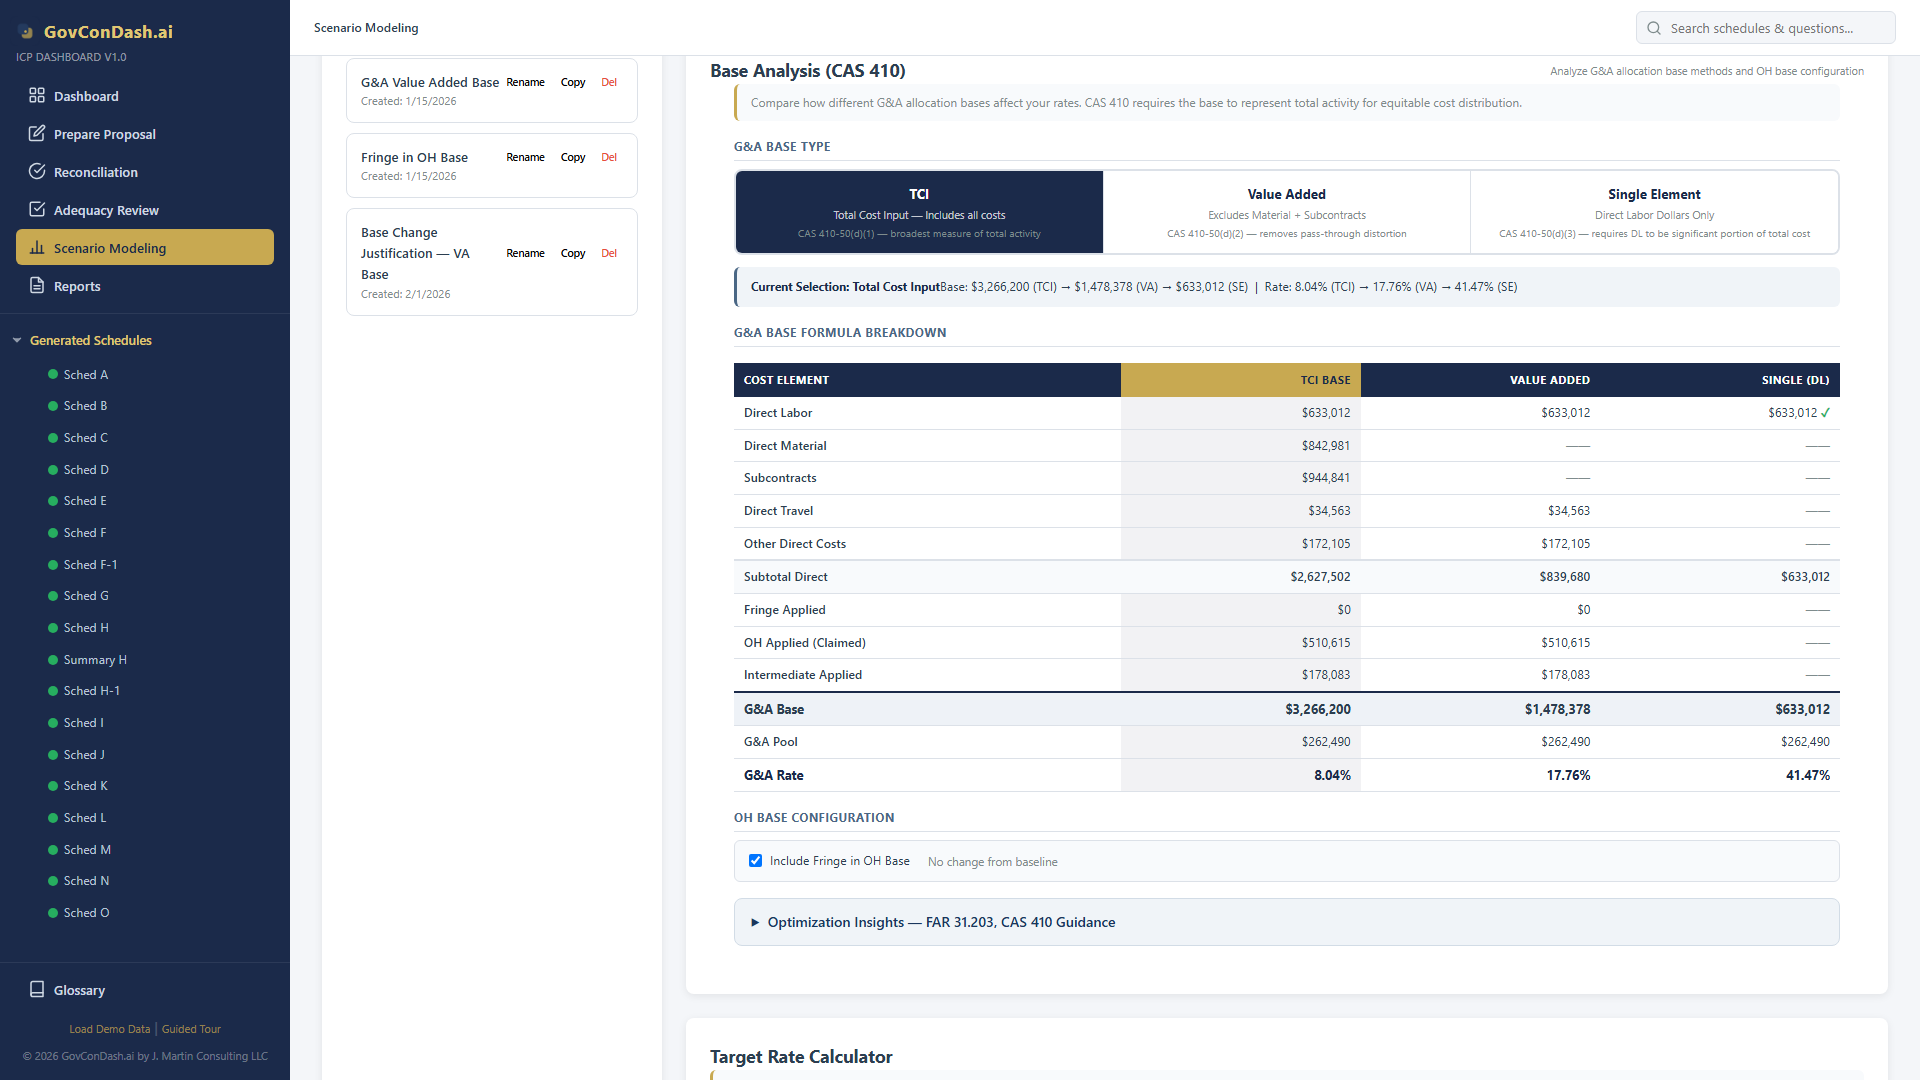
Base Change Analysis tab with summary card, historical data, and analysis panels
The regression analysis requires multiple years of historical G&A pool and base data. For each fiscal year, enter:
You can also import from prior-year ICE workbooks (upload Excel files and the system parses Schedule B and GL data) or click “Use Current Year Data” to auto-populate from your generated schedules.
Historical data entry form with fiscal year entries and import options
FAR 31.203(e) requires documenting the changed circumstances that warrant a base change. Use the text area to describe business changes — for example, significant growth in subcontract spending, organizational restructuring, new product lines, or major contract type shifts. This narrative is included in exported reports.
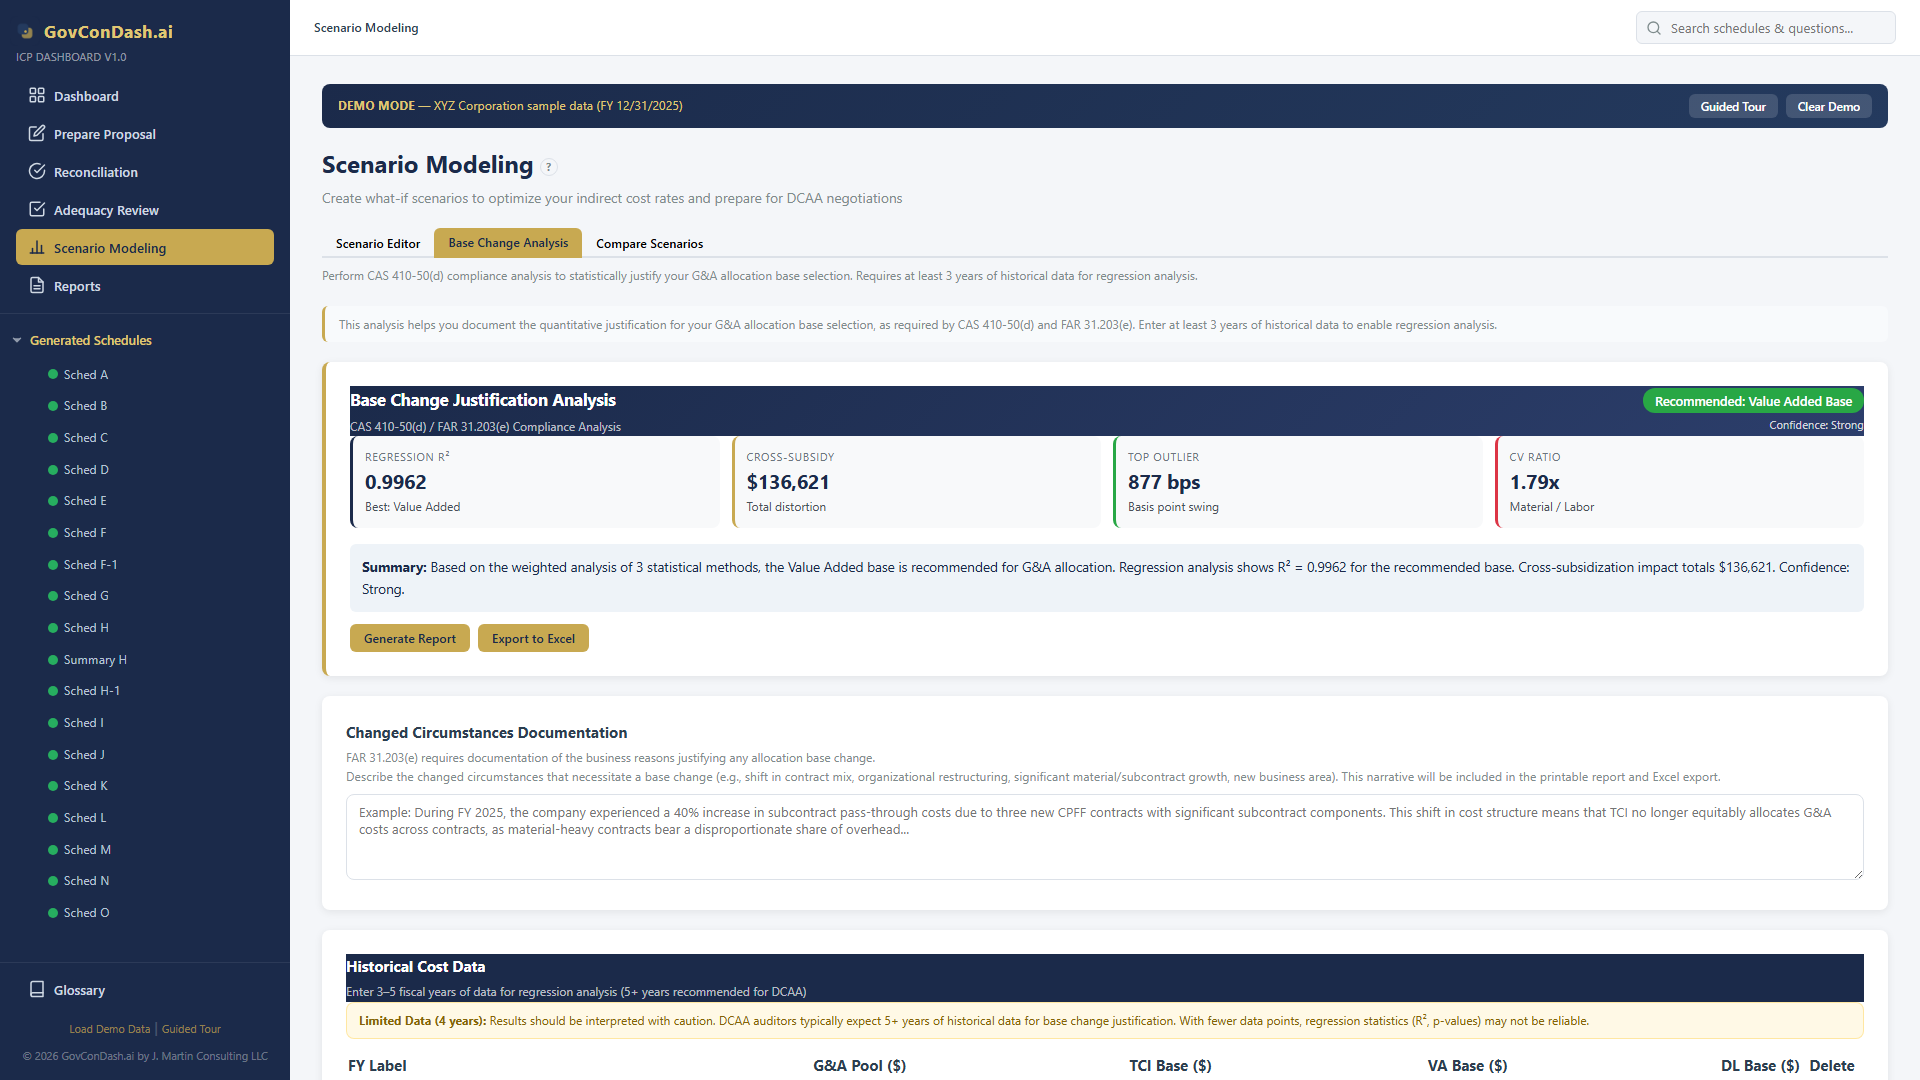
At the top of the analysis tab, a summary card shows the overall recommendation with a confidence badge:
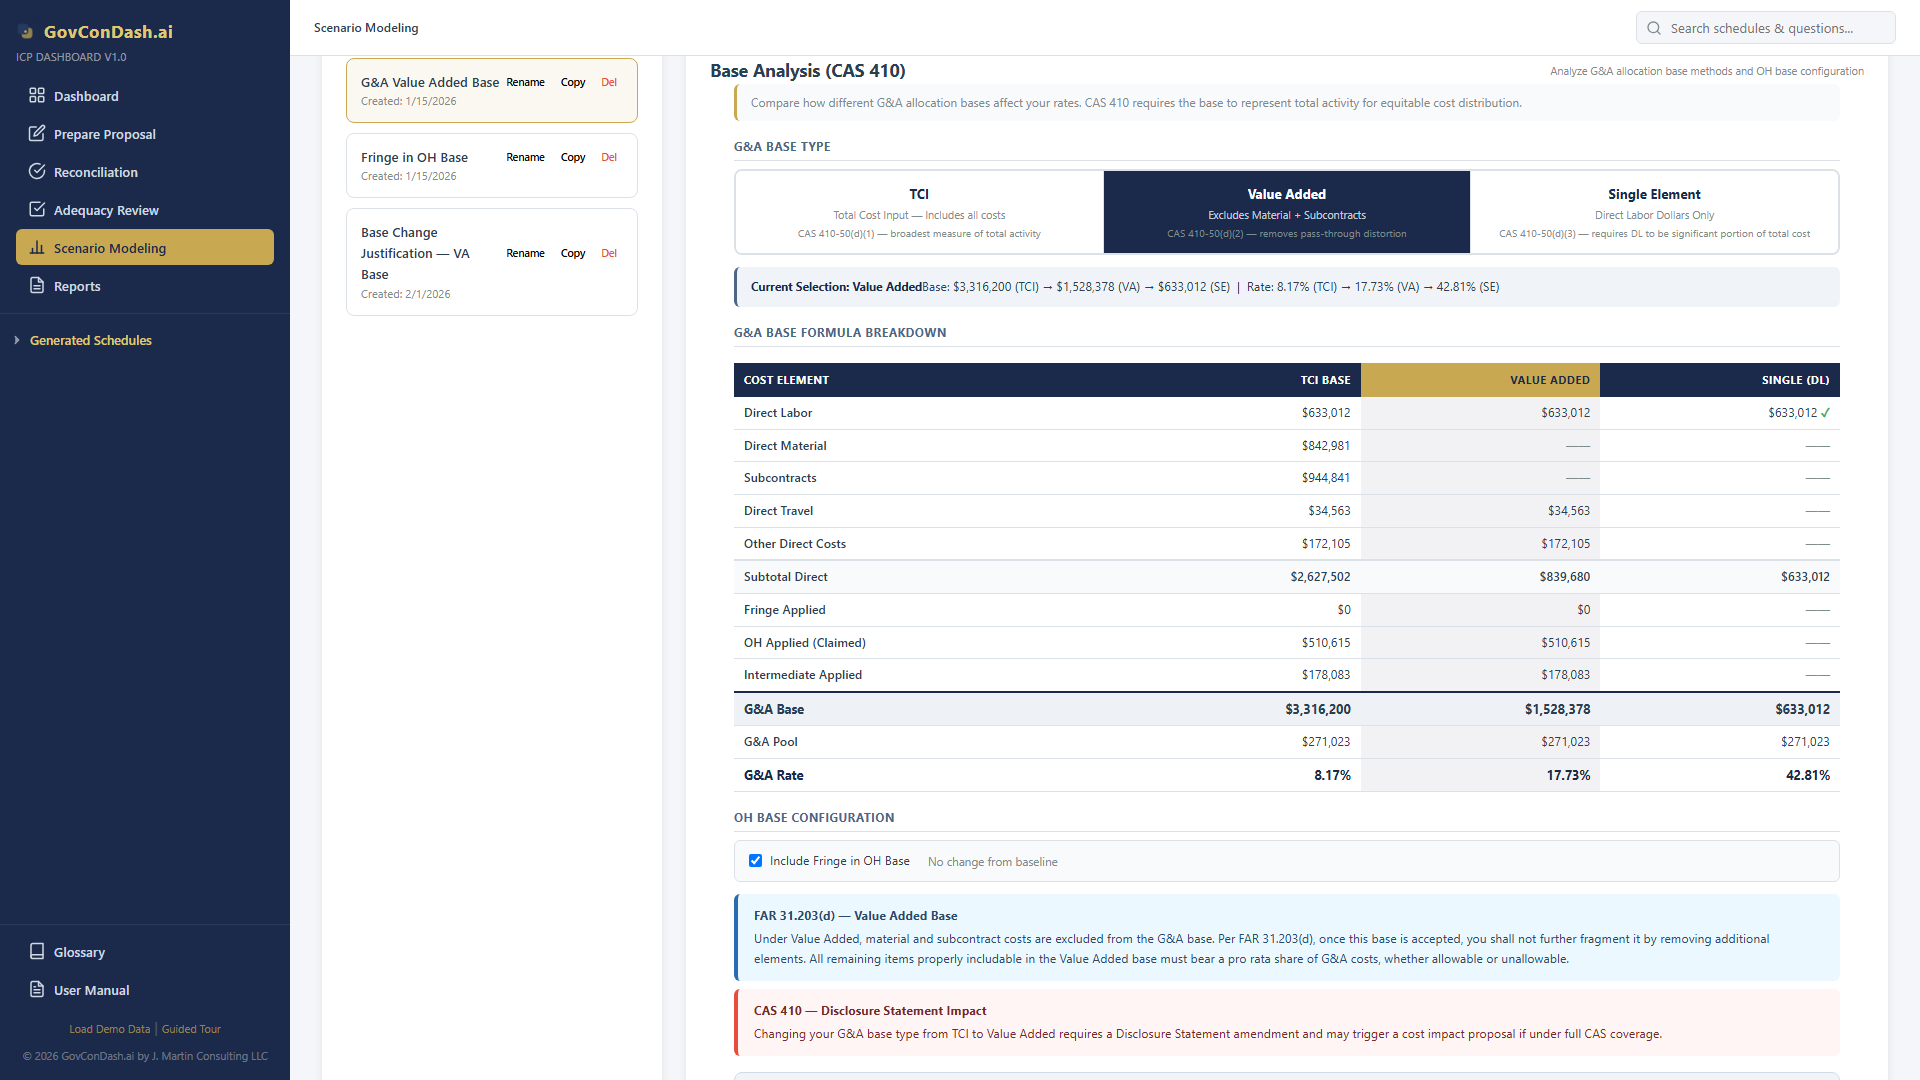
Analysis summary showing recommended base type, confidence level, and key metrics
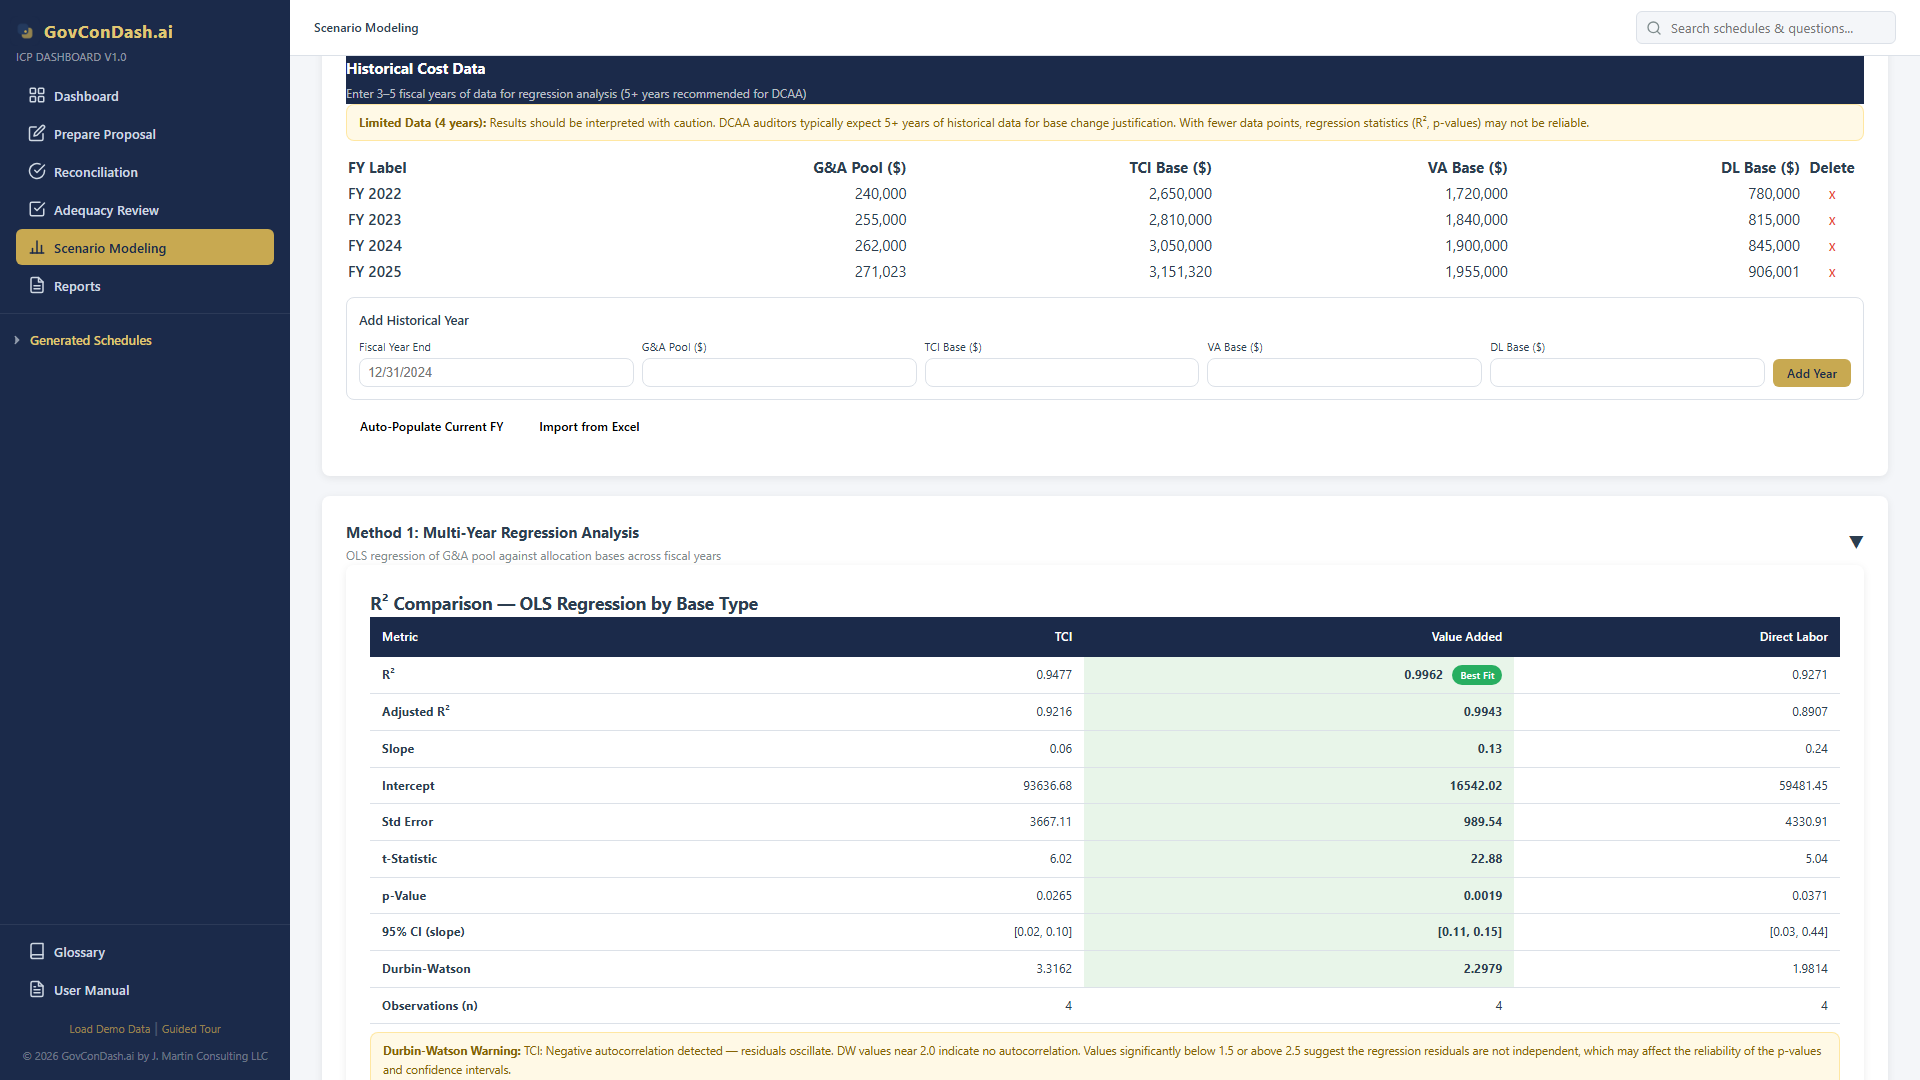
Ordinary Least Squares regression tests how well each allocation base (TCI, Value Added, Direct Labor) predicts the G&A pool over time. The base with the highest R² is the best statistical predictor.
Three scatter plots comparing TCI, Value Added, and Direct Labor bases vs. G&A pool with regression lines and R² values
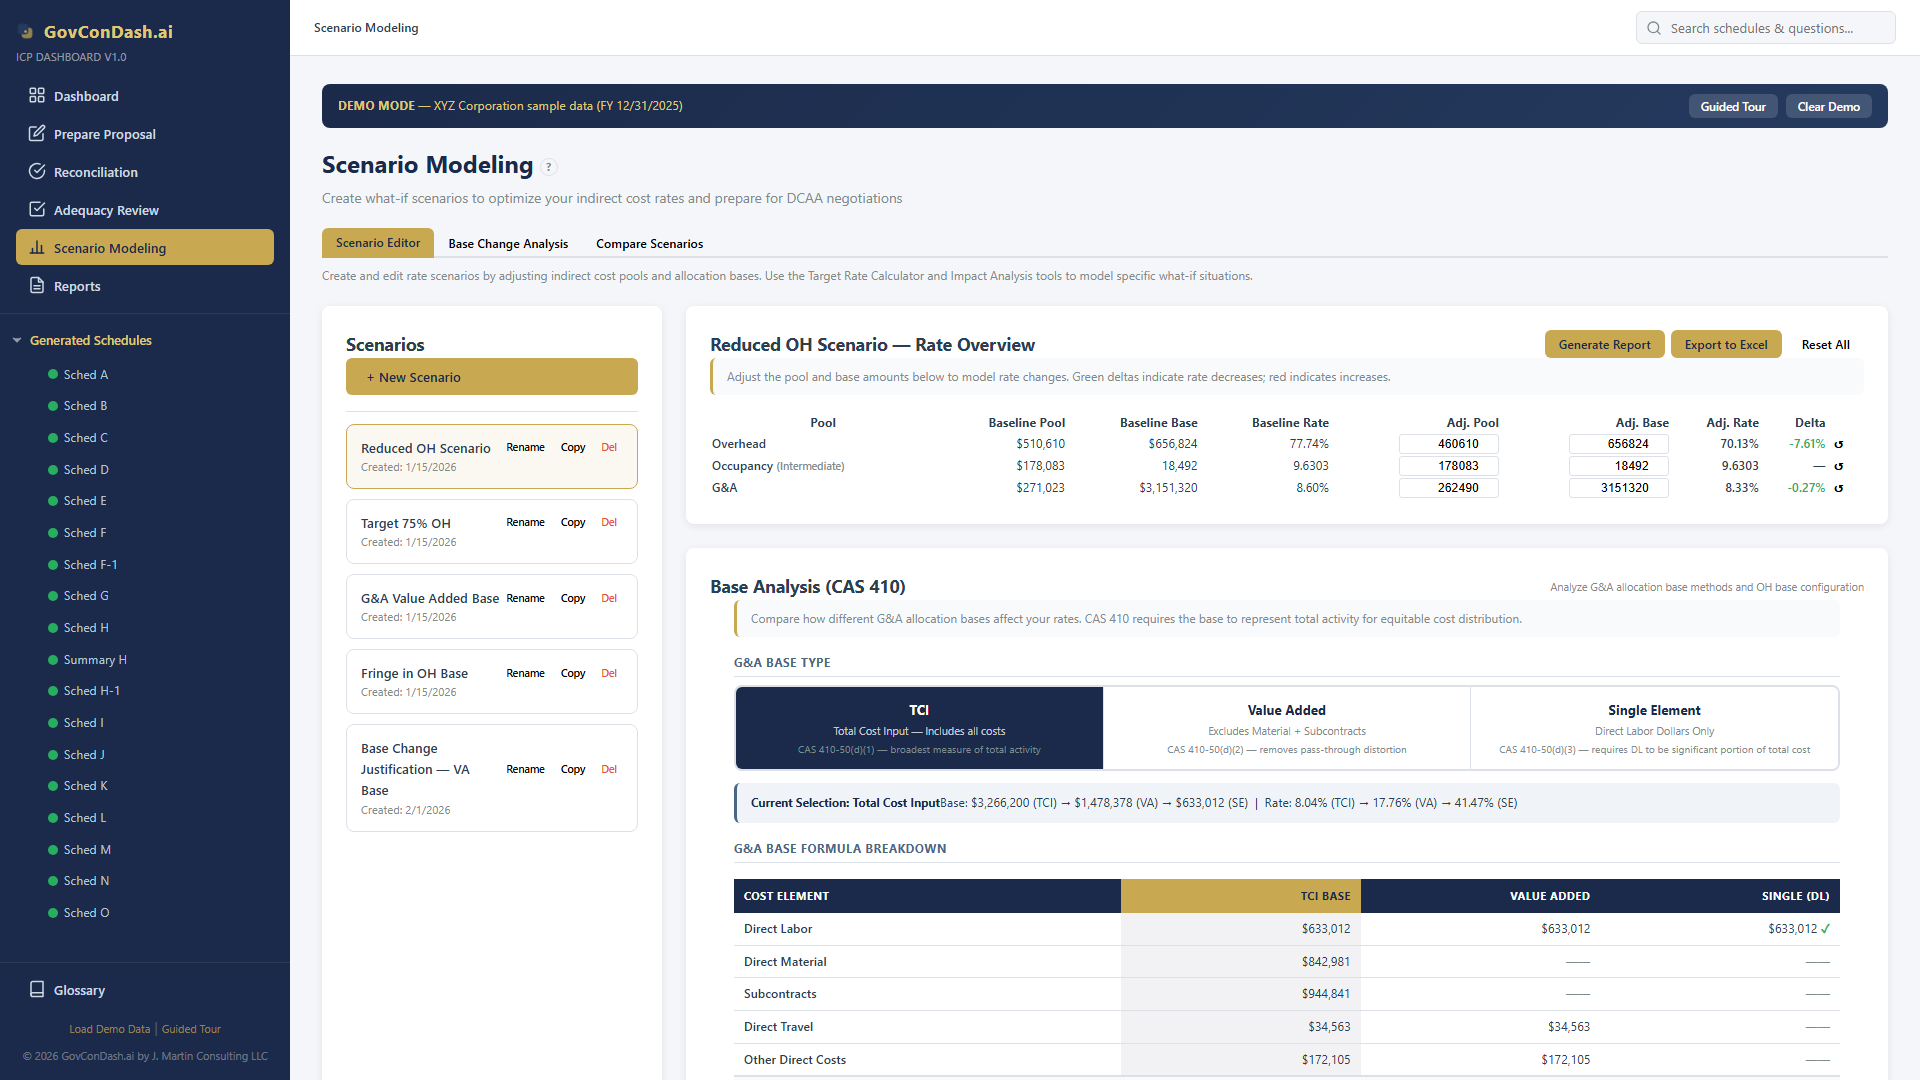
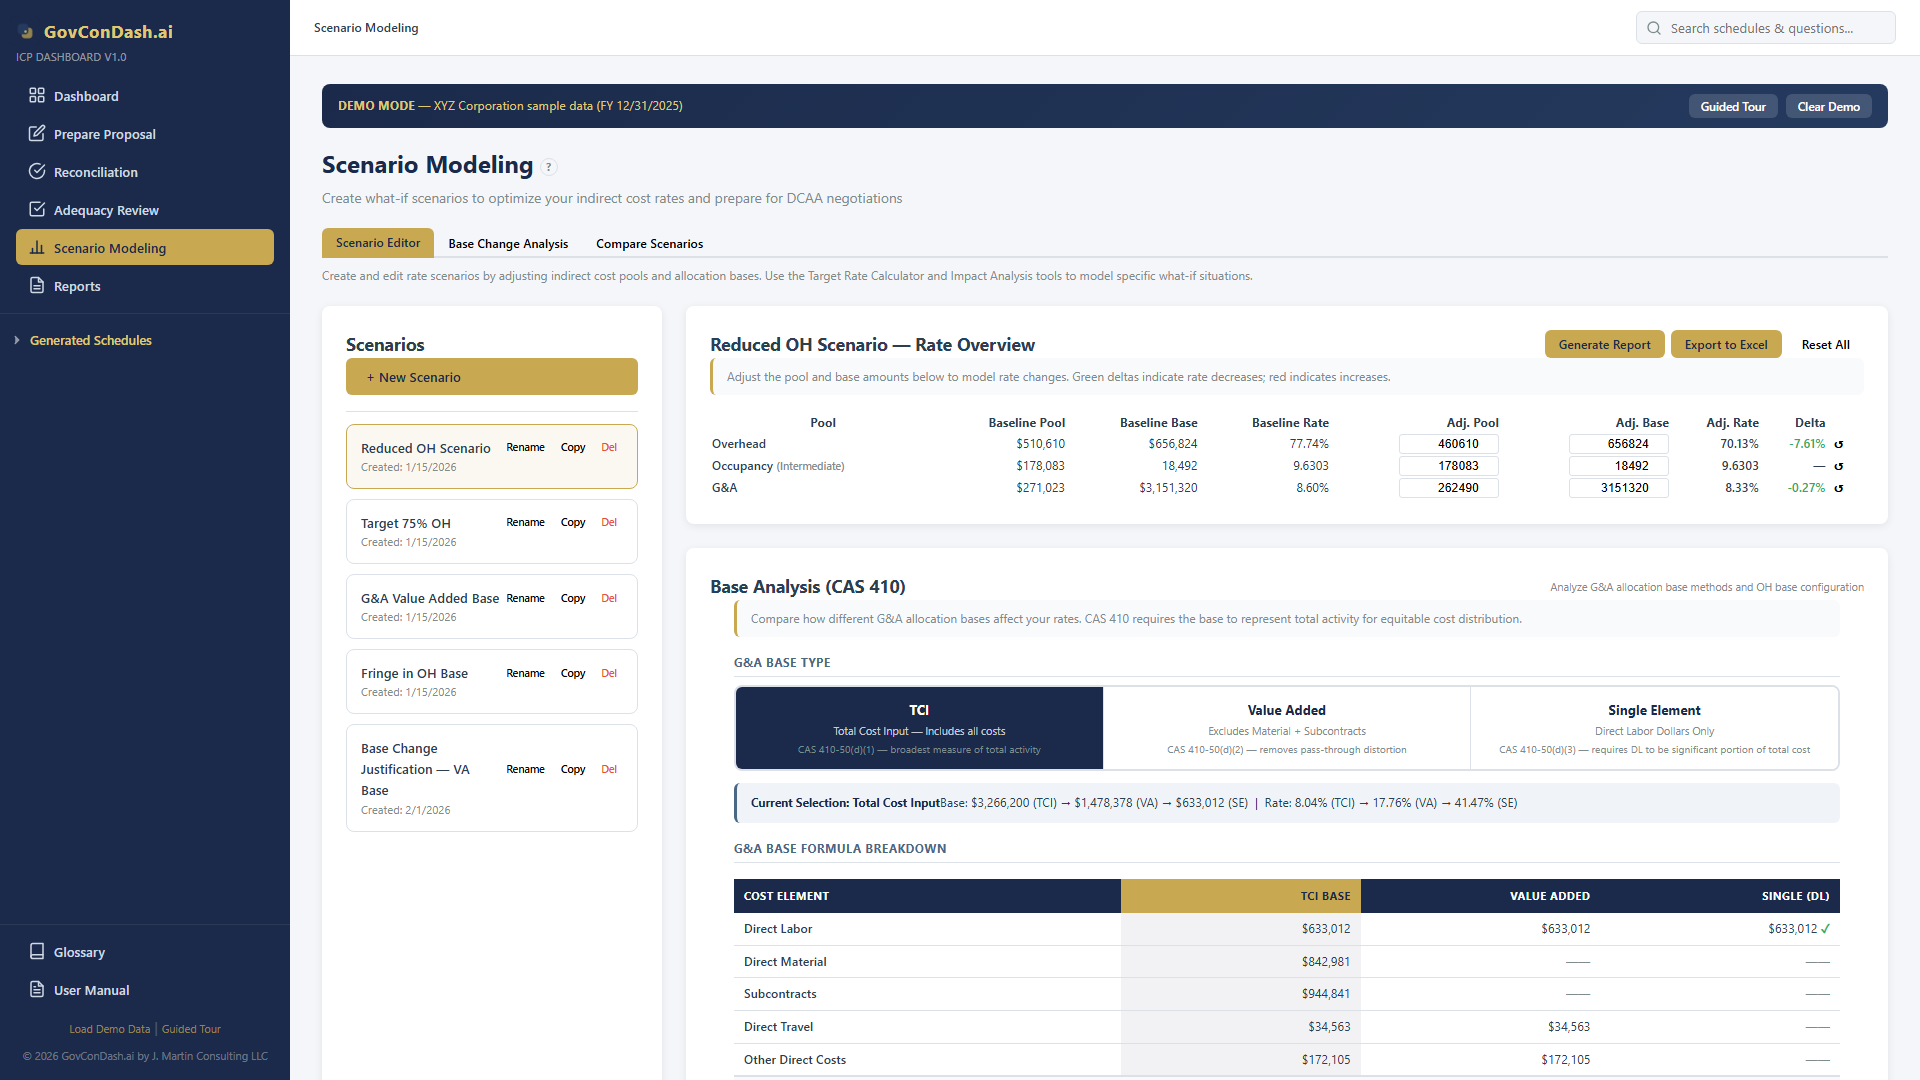
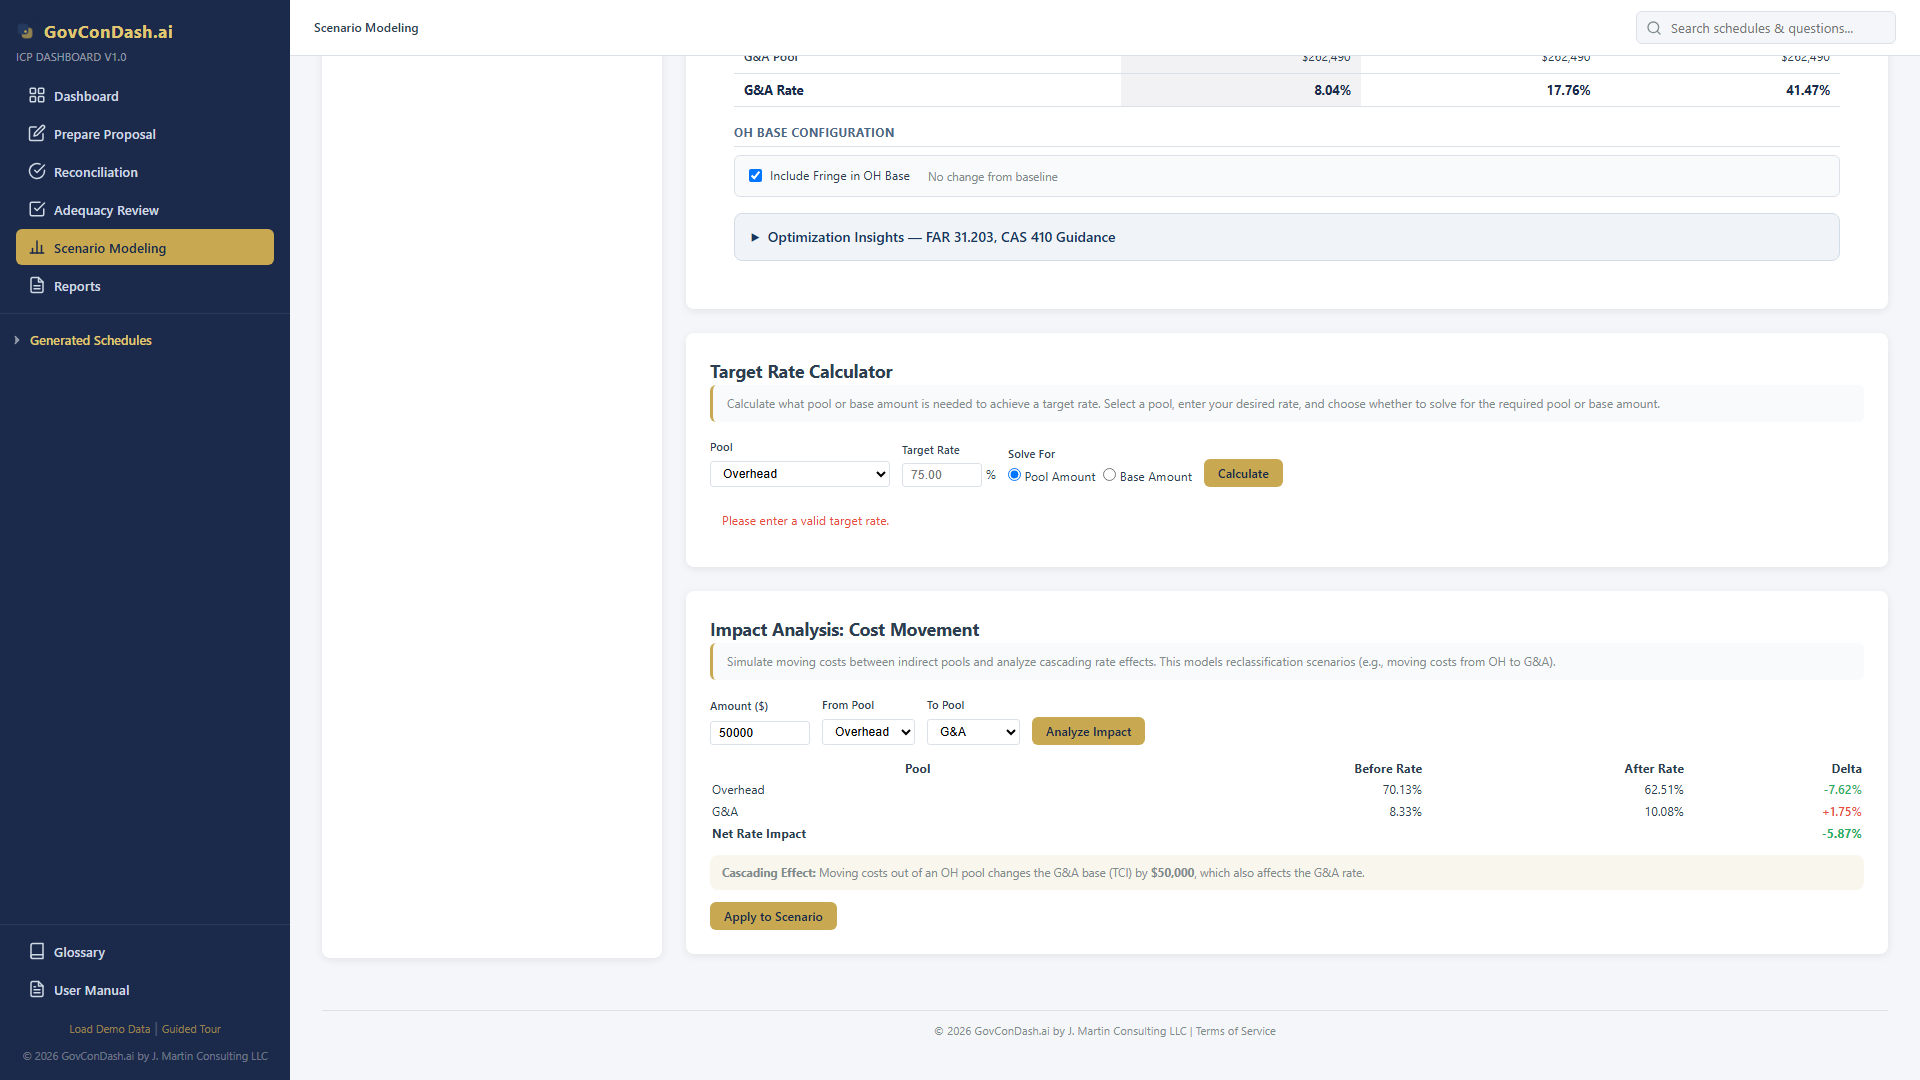
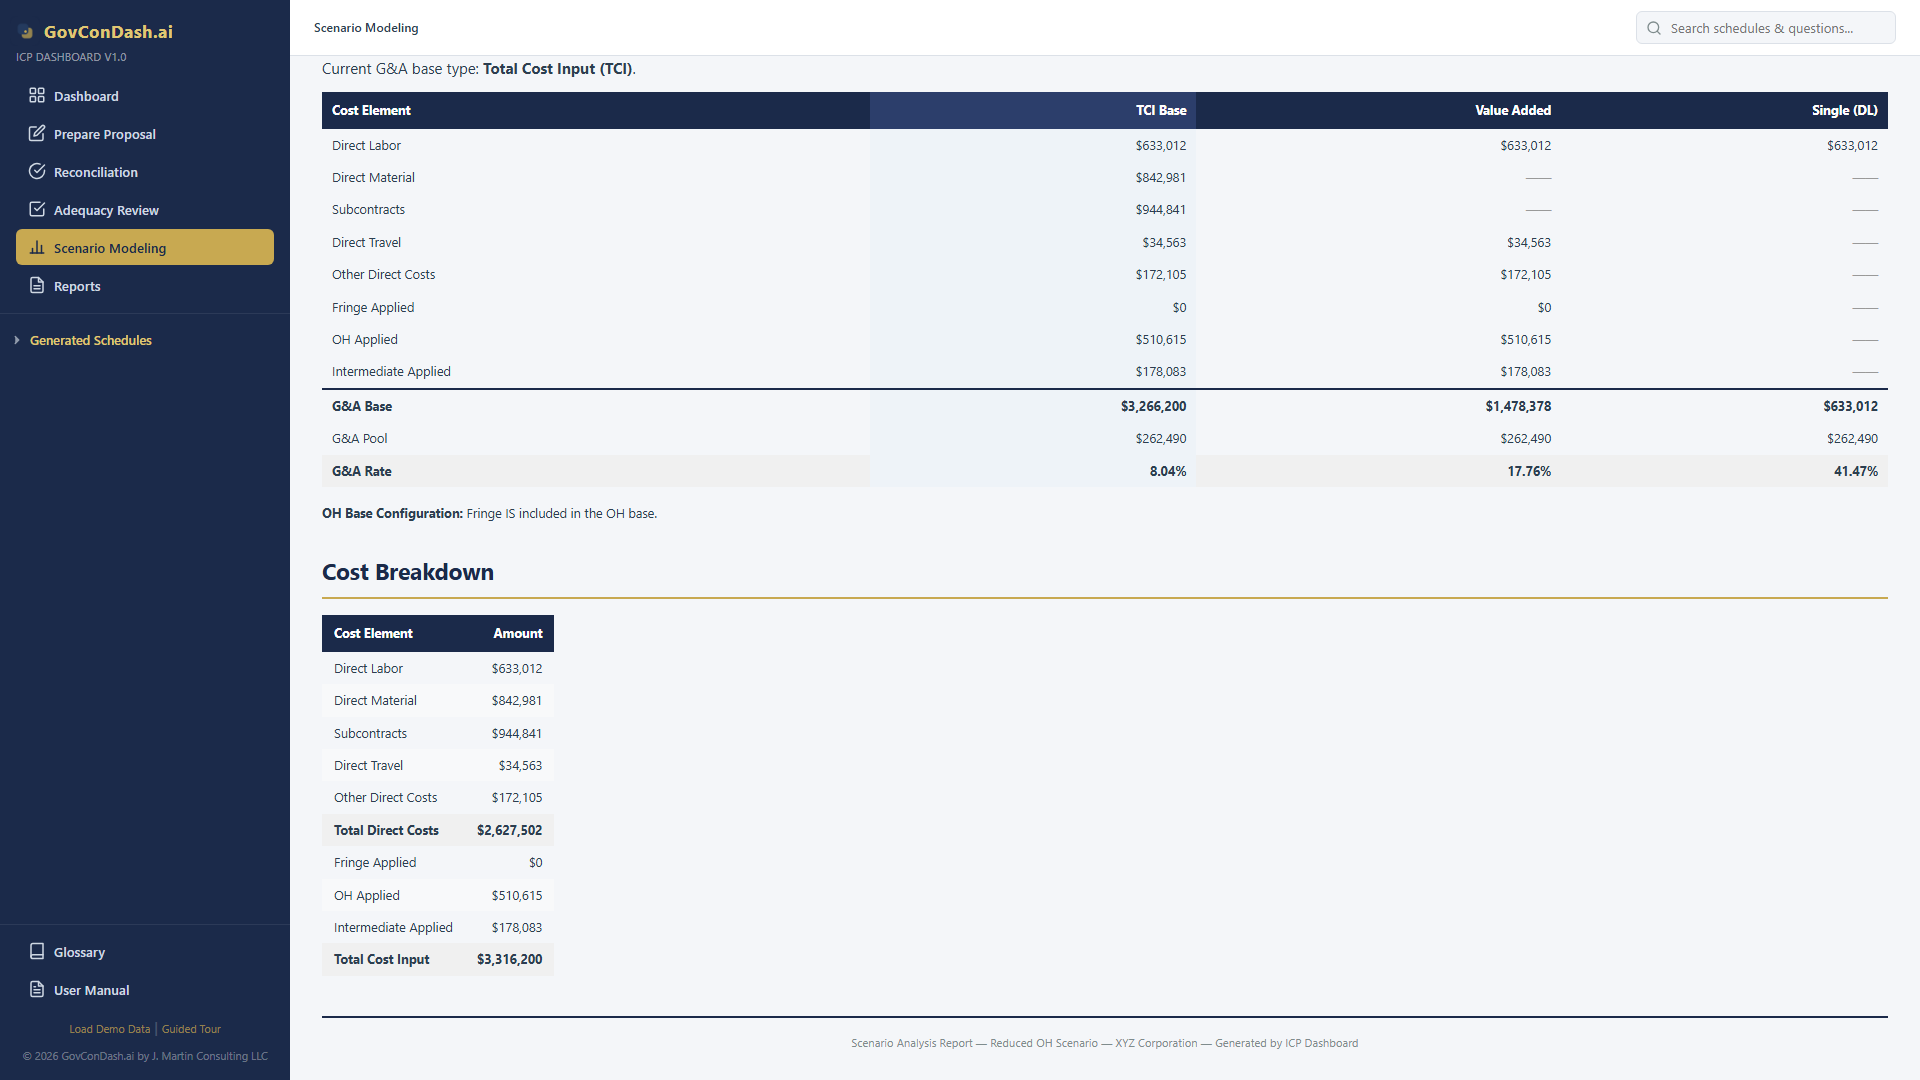
This method examines how each base type affects G&A allocation at the individual contract level. It computes the G&A rate and allocation amount for every contract under each base type and identifies cross-subsidization — contracts that would pay more or less G&A under different bases.
It also flags the CAS 410-50(d)(3) threshold: if direct labor is less than 15% of TCI, using Single Element as the base is questionable because labor is not a significant portion of total activity.
Rate Impact Analysis showing contract-level G&A allocation under each base type
The sensitivity analysis looks at how concentrated material and subcontract costs are across your contract portfolio, helping assess whether pass-through distortion justifies a Value Added base:
Sensitivity and Outlier Analysis with Pareto concentration and CV comparison
The tool aggregates findings from all three methods using a voting system. Each method contributes its recommended base type, and the overall recommendation reflects the consensus:
The table has one column per scenario plus the baseline. For each indirect cost pool, three rows are displayed:
A G&A Base Type row at the top of the G&A section shows each scenario’s selected base type. If any scenario uses a different base type than baseline, a warning note appears: “Different G&A base types — rates reflect different methodologies.”
Side-by-side comparison of multiple scenarios against baseline with delta highlighting
Expand the collapsible “G&A Base Breakdown” section to see exactly which cost elements (Direct Labor, Material, Subcontracts, Travel, ODC, Fringe, OH) are included in each scenario’s G&A base. Excluded items show an em-dash (—).
G&A base breakdown showing cost element differences across scenarios
Full-screen printable HTML report with executive summary, rate overview (baseline vs. adjusted), CAS 410 base analysis, and cost breakdown. Use your browser’s Print function to save as PDF.
Multi-sheet .xlsx workbook containing summary, rate comparison, base analysis detail, and formulas. Professional formatting with headers, number formats, and alternating row colors.
6-sheet .xlsx workbook: Summary, Regression, Rate Impact, Sensitivity, Cost Impact, and Regulatory References. Comprehensive documentation for CAS 410-50(d) justification.
Printable scenario analysis report with executive summary and rate comparison
Always document changed circumstances before proposing a base type change. FAR 31.203(e) requires a clear rationale.
Use 5+ years of historical data for your regression analysis. More data points produce stronger statistical evidence.
Always evaluate TCI, Value Added, and Single Element before committing. One may be clearly superior for your cost profile.
When moving costs between OH and G&A, remember that TCI and VA bases cascade. Use Impact Analysis to see the full picture.
The FAR/CAS guidance in the Base Analysis card covers anti-fragmentation, consistency, and revision triggers. Review before deciding.
Export reports and Excel workbooks for your DCAA submission file. Documented analysis demonstrates due diligence.
| Reference | Topic | Key Requirement |
|---|---|---|
| FAR 31.203(b) | Consistency | Once an allocation method is established, follow it consistently across cost accounting periods |
| FAR 31.203(c) | Beneficial/Causal | Allocation base must reflect a beneficial or causal relationship to the costs being allocated |
| FAR 31.203(d) | Anti-Fragmentation | Cannot fragment the base to eliminate costs from bearing a fair share of indirect expenses |
| FAR 31.203(e) | Revision Triggers | Changed circumstances (organizational, contractual, cost profile) warrant reassessment of allocation methods |
| FAR 31.203(g) | Base Period | Use the contractor’s fiscal year as the cost accounting period for indirect cost allocation |
| CAS 410-50(d)(1) | TCI Base | Broadest measure of total activity is preferred; represents total contractor activity for the period |
| CAS 410-50(d)(2) | Distortion Test | Elements may be excluded only if their inclusion would distort allocation to final cost objectives |
| CAS 410-50(d)(3) | Insignificant Element | Single cost element base requires the element to be a significant portion of total cost |
| CAS 418 | Direct/Indirect | Governs allocation of direct and indirect costs to final cost objectives (contracts) |
| FAR 42.703 | Administration | CO and auditor responsibilities for administering indirect cost rates and establishing final rates |