ICP Dashboard
Feature Overview
Browser-Based Incurred Cost Proposal Preparation Tool
15+
ICE Schedules
47
Adequacy Checks
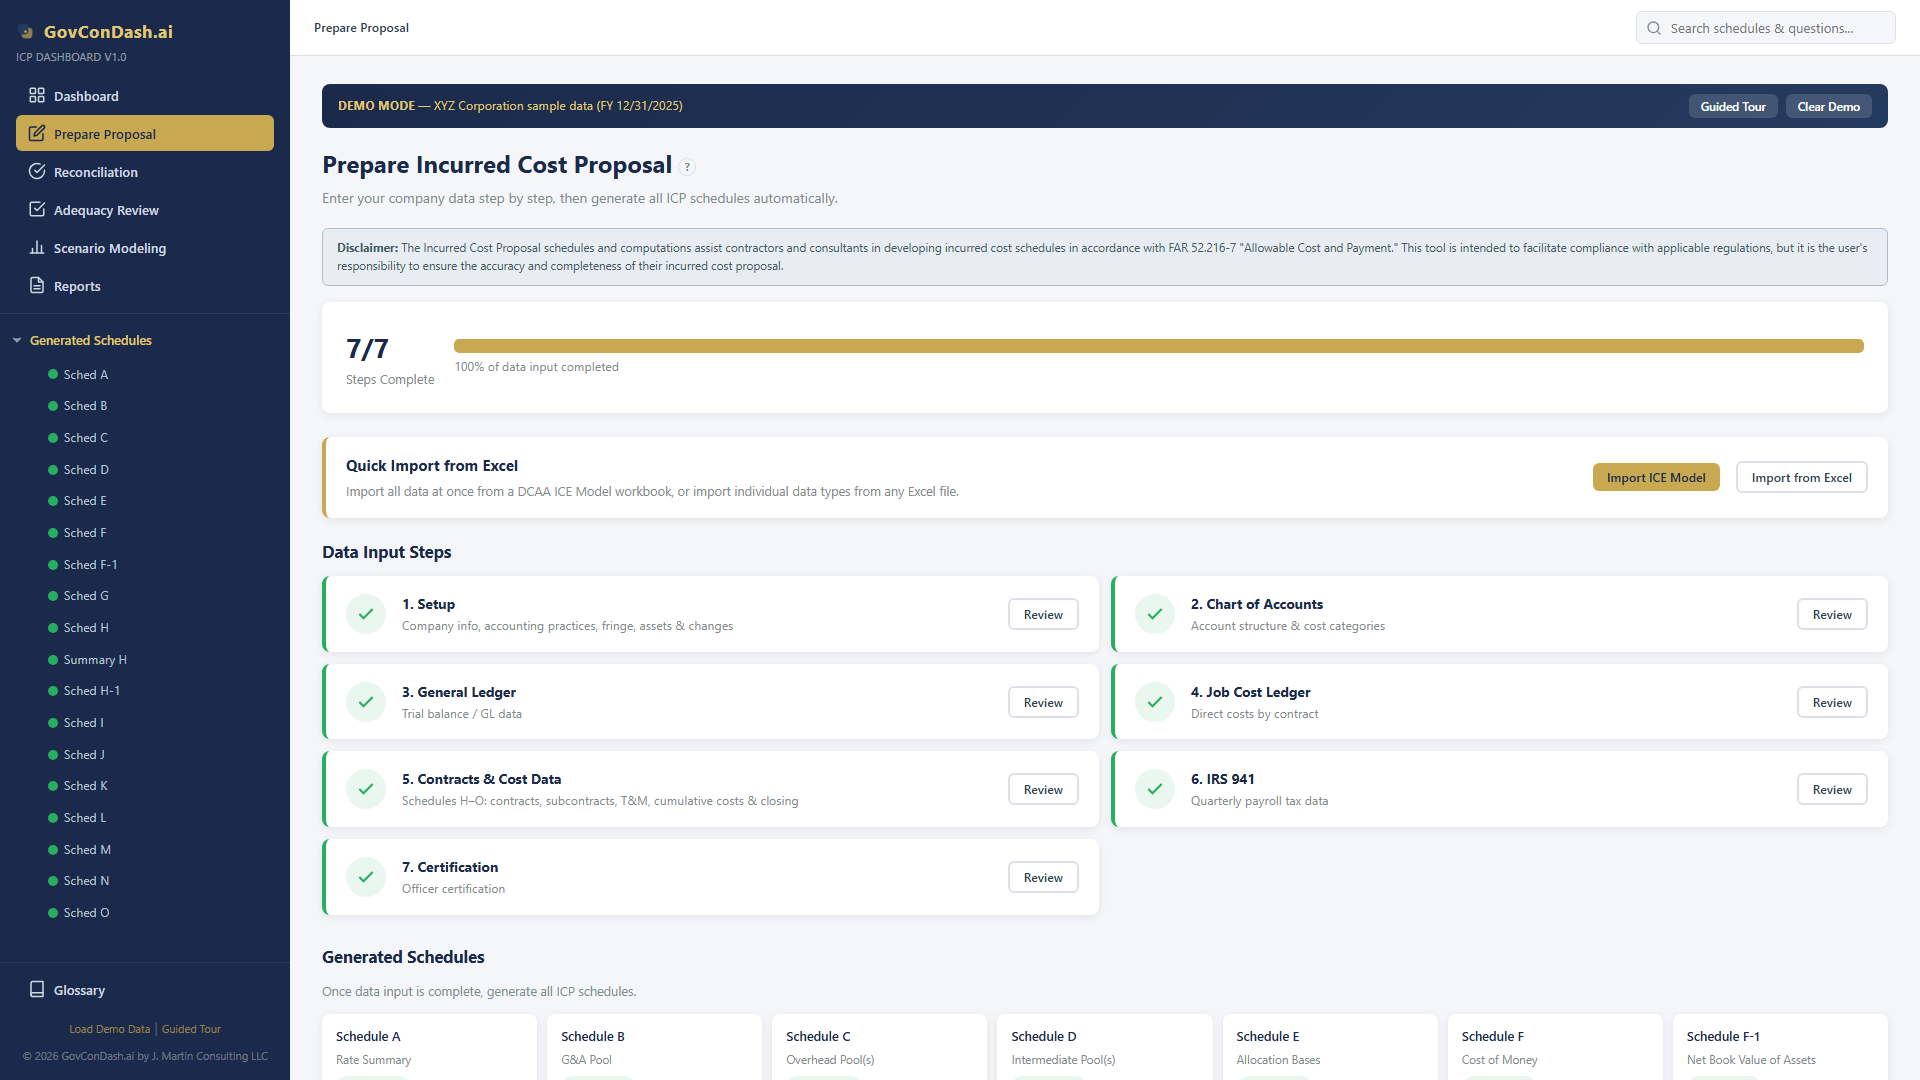
7
Step Wizard
21
FAR 31.205 Rules
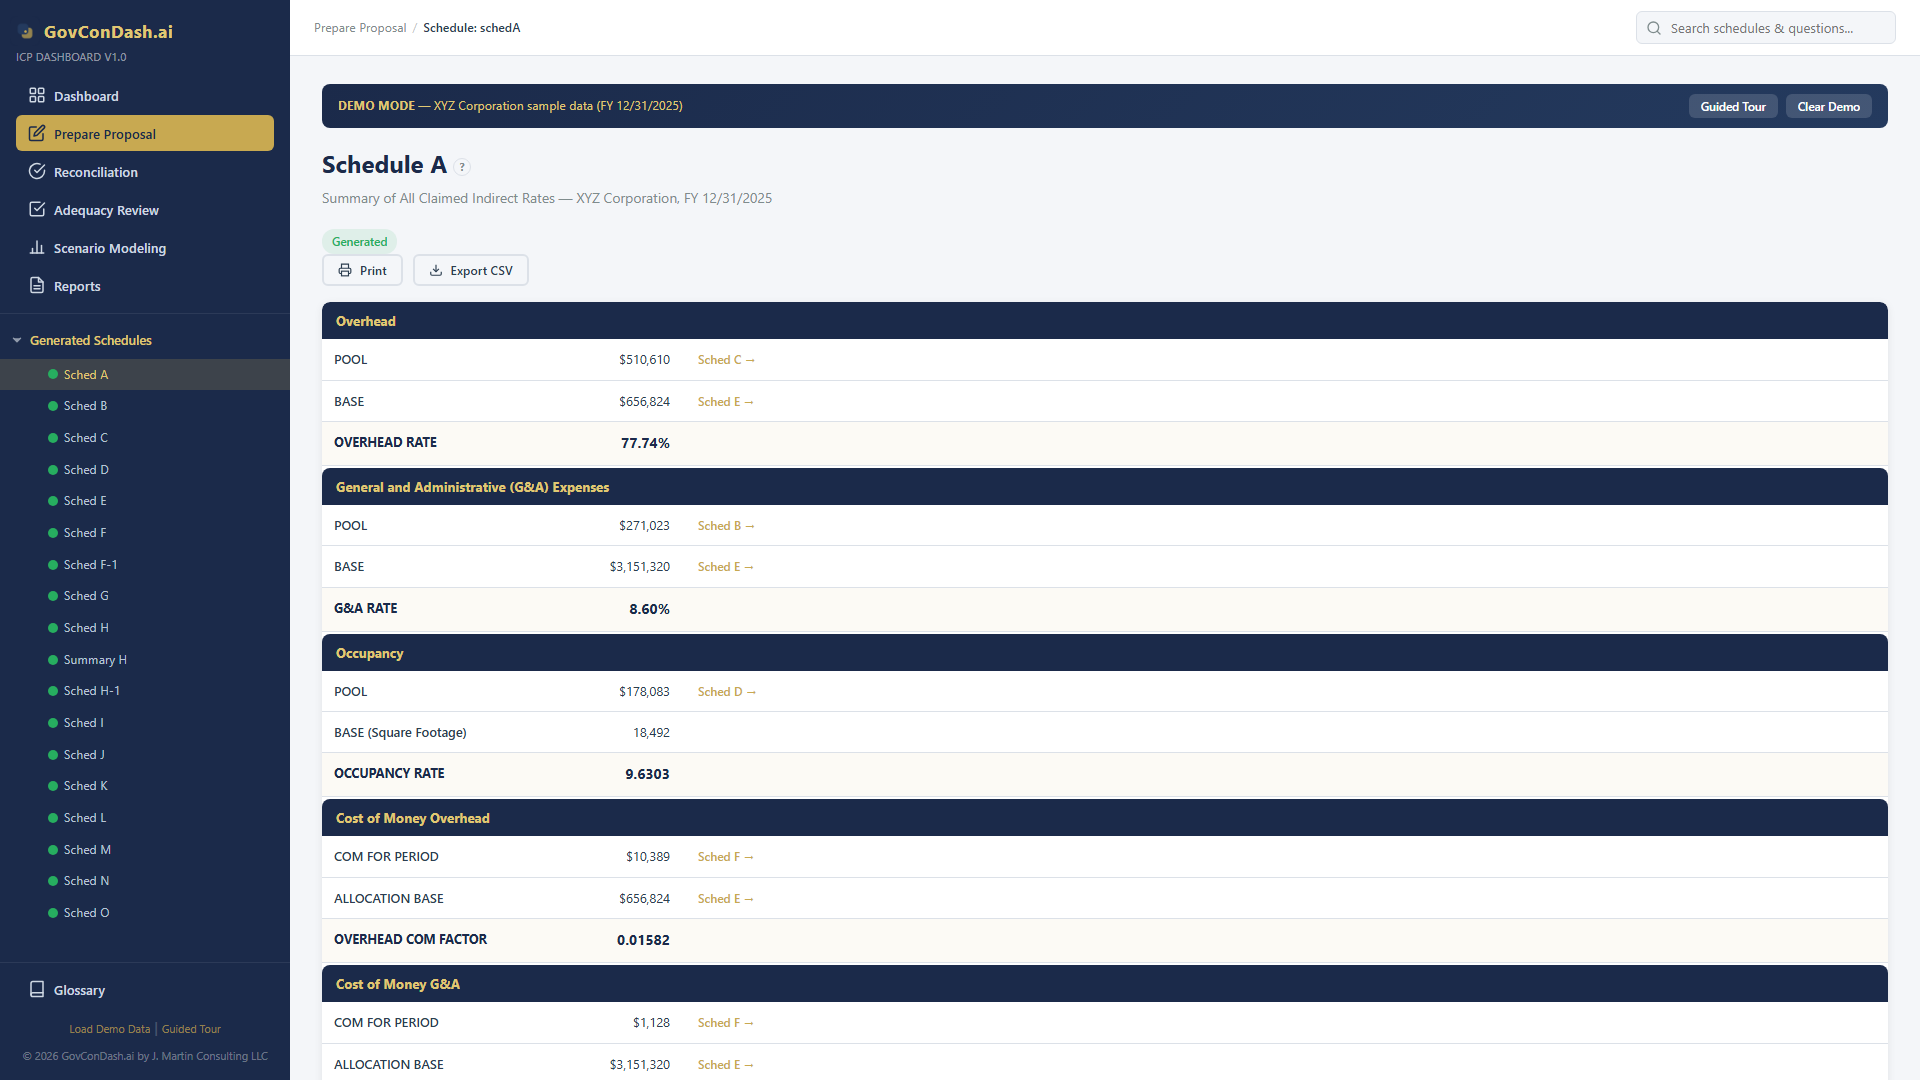
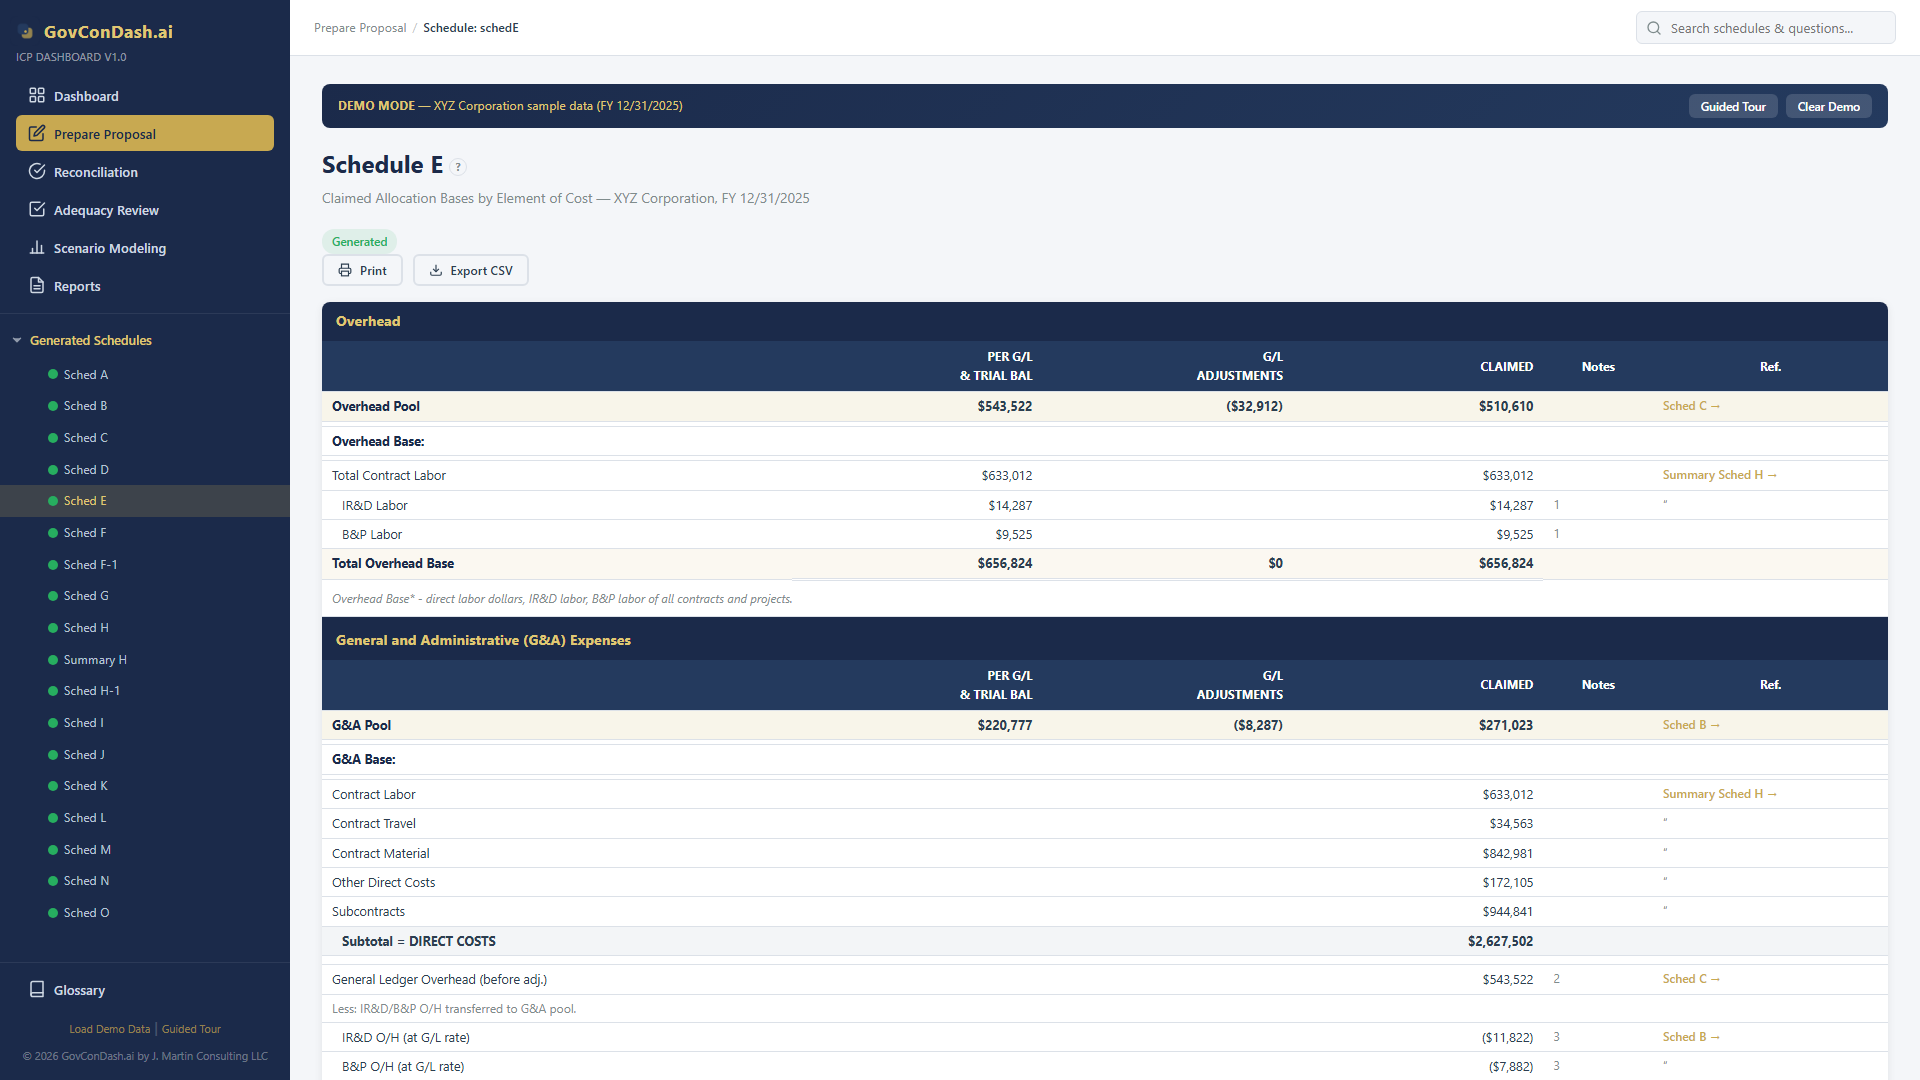
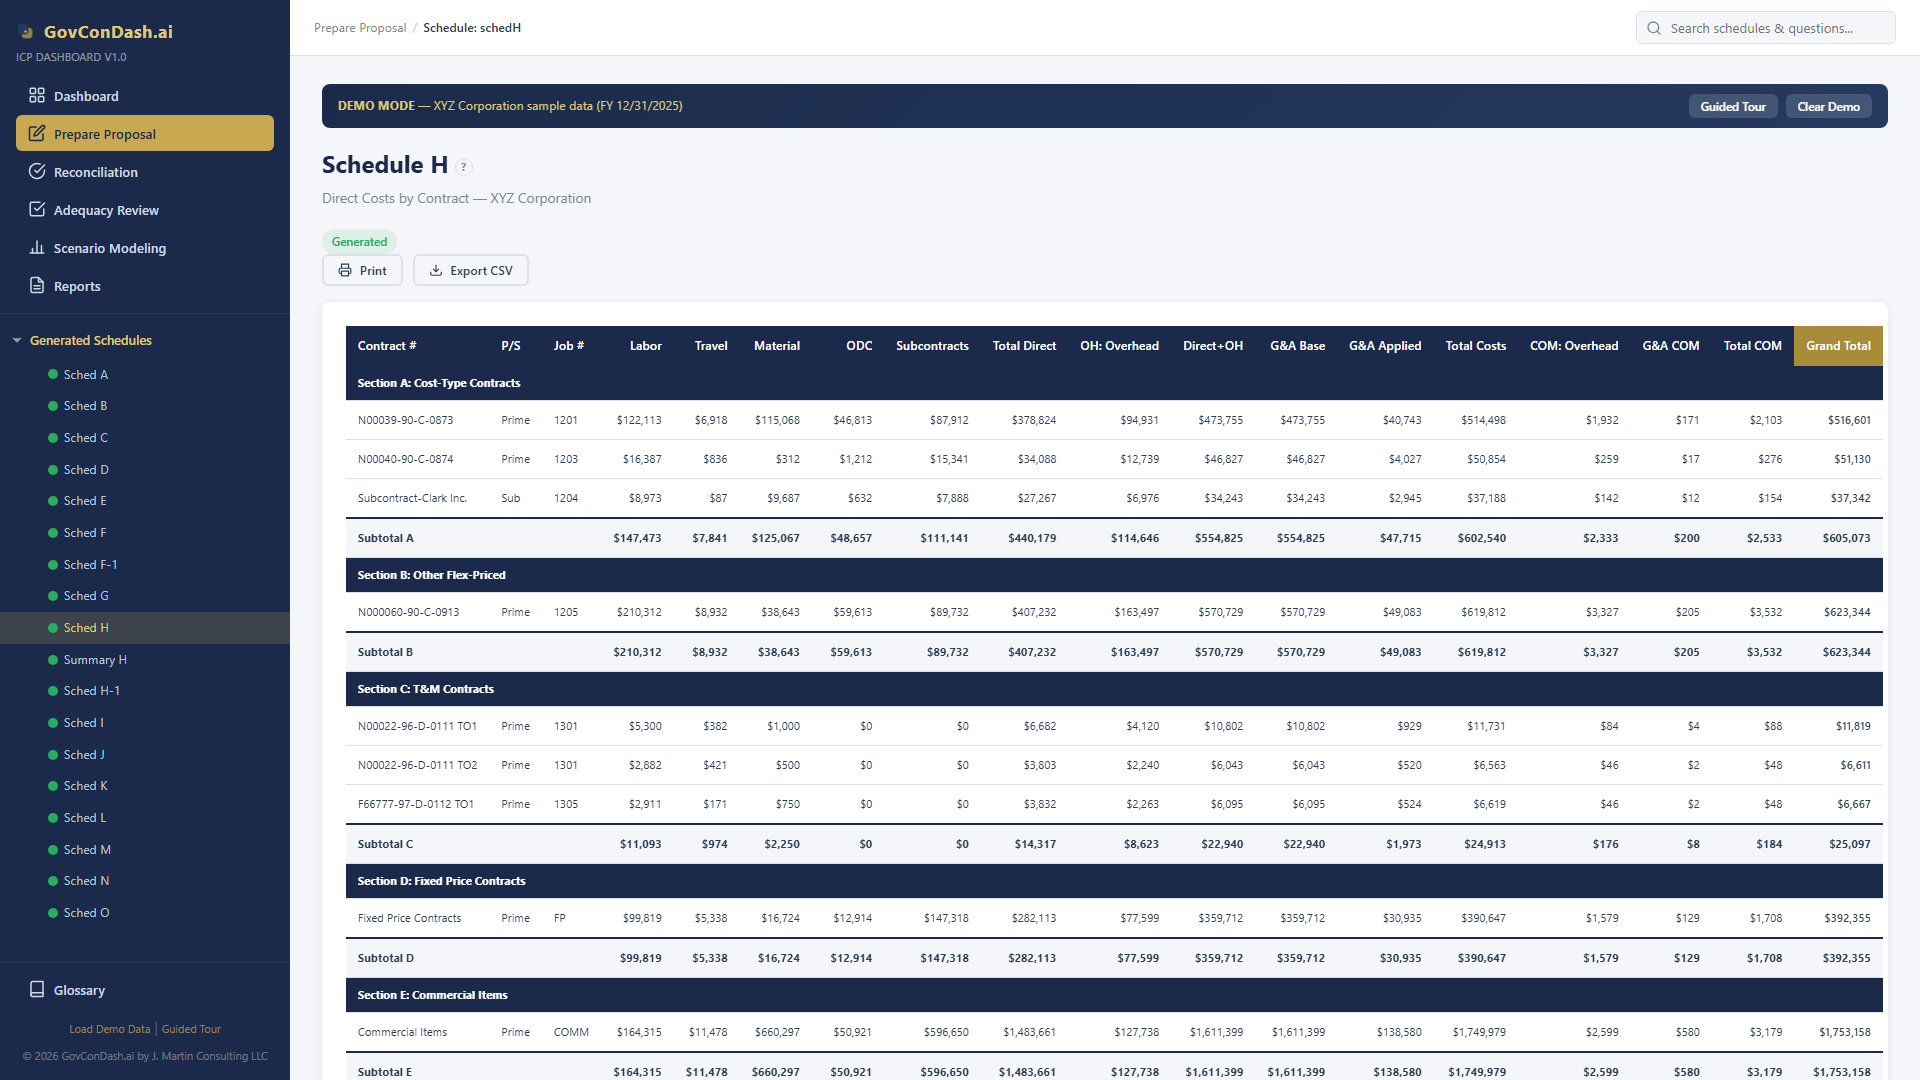
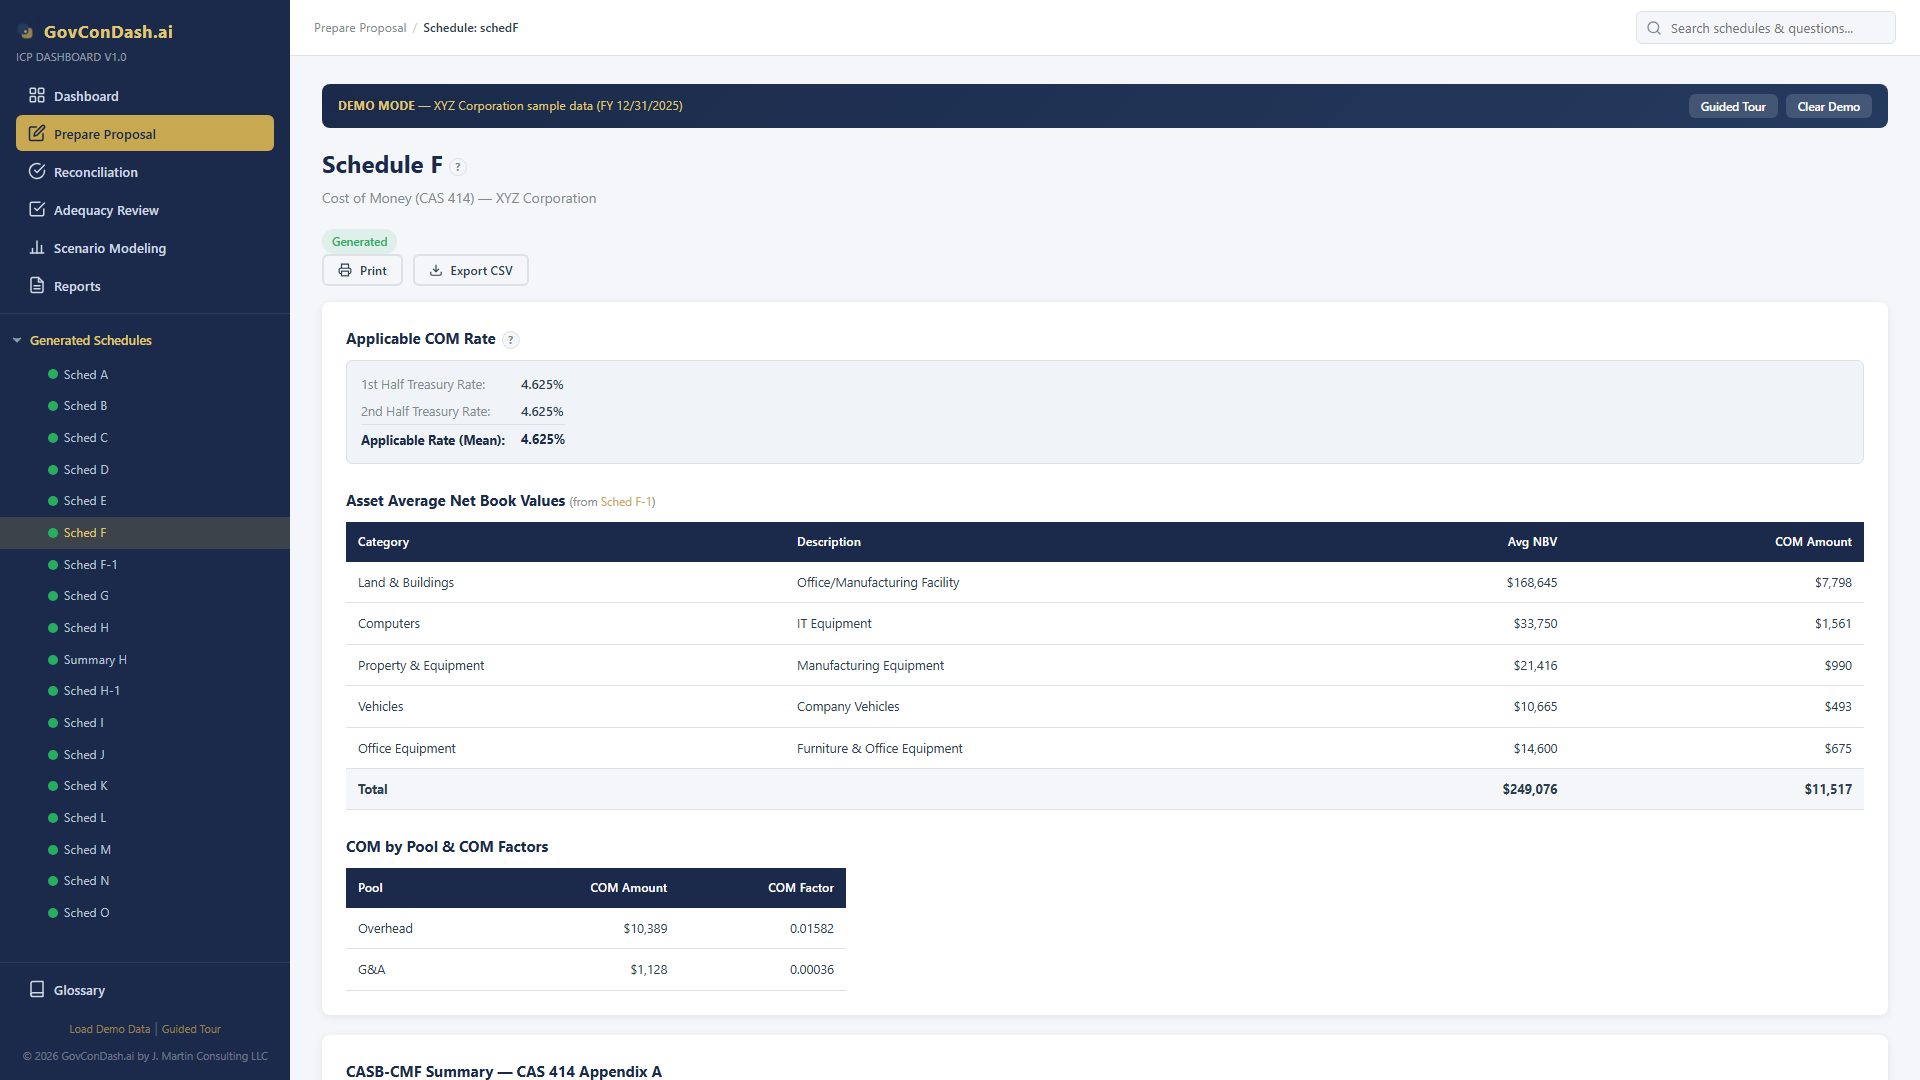
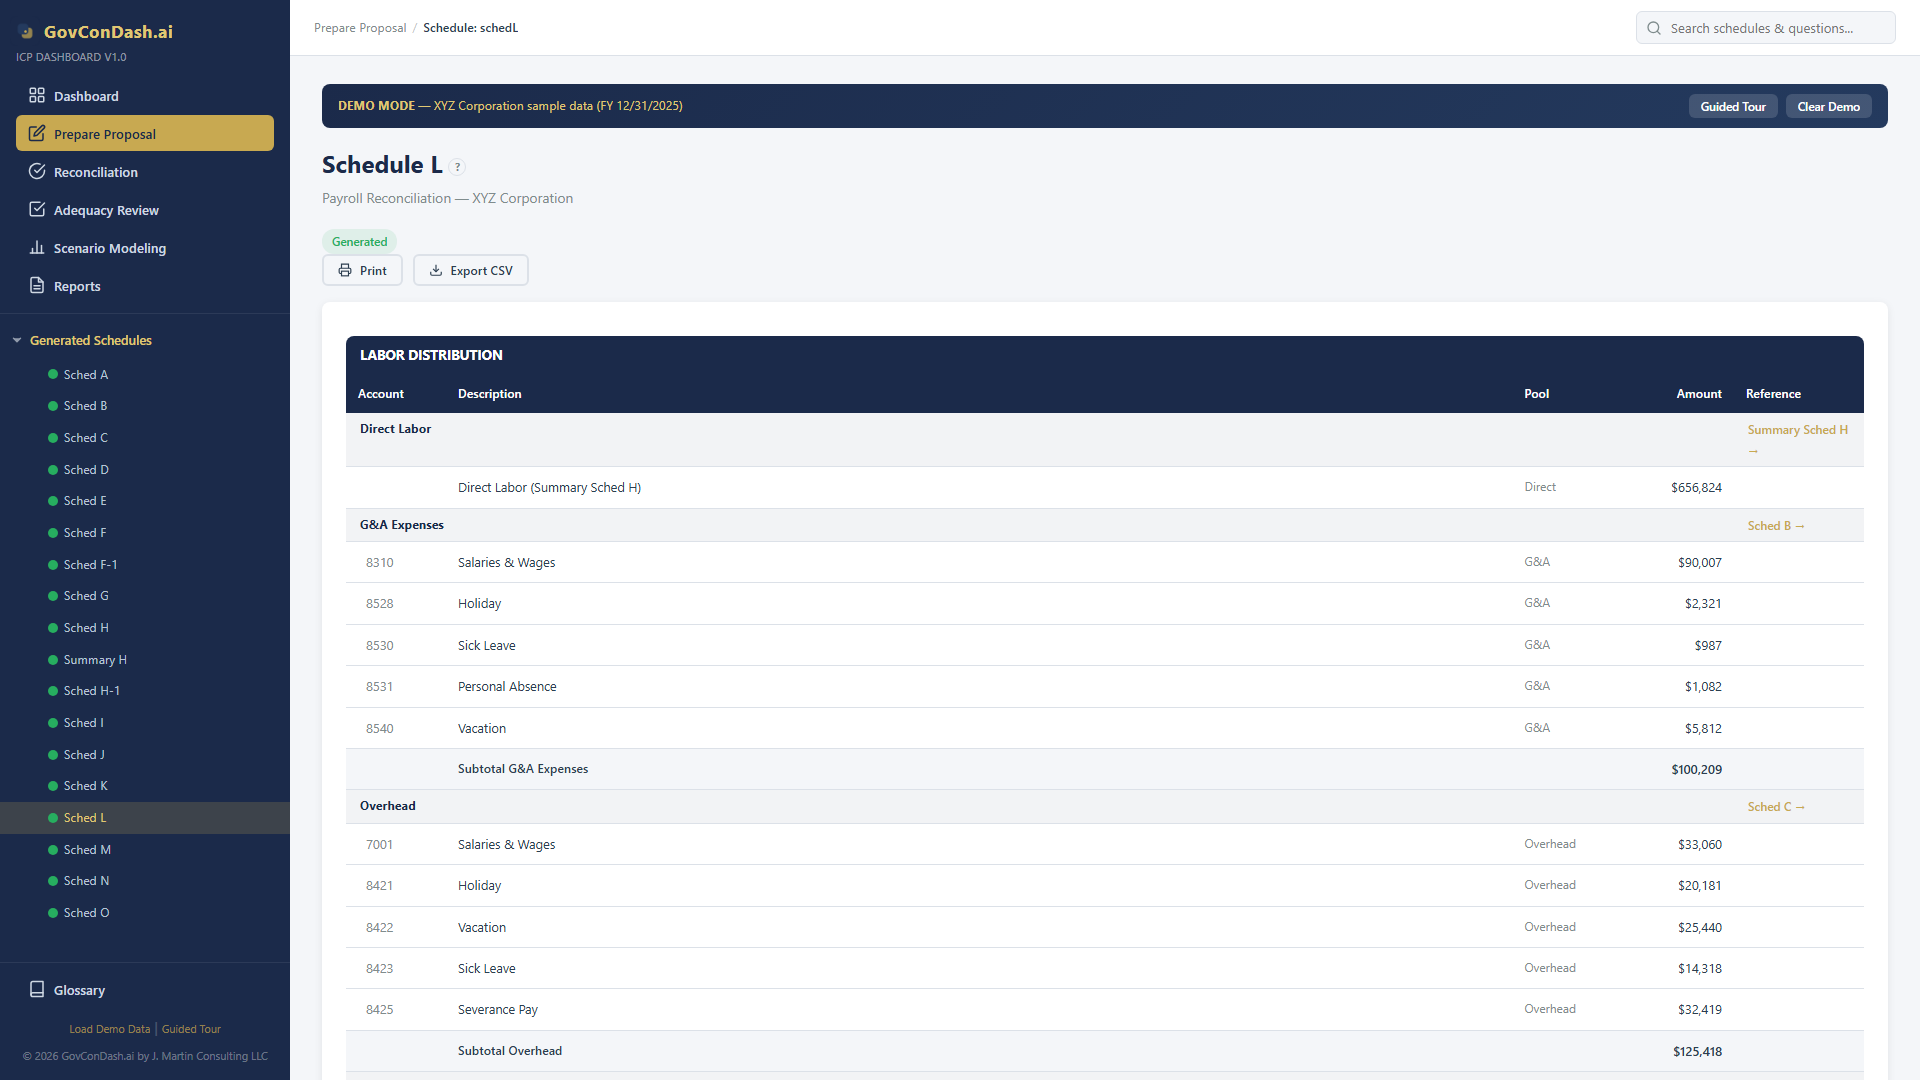
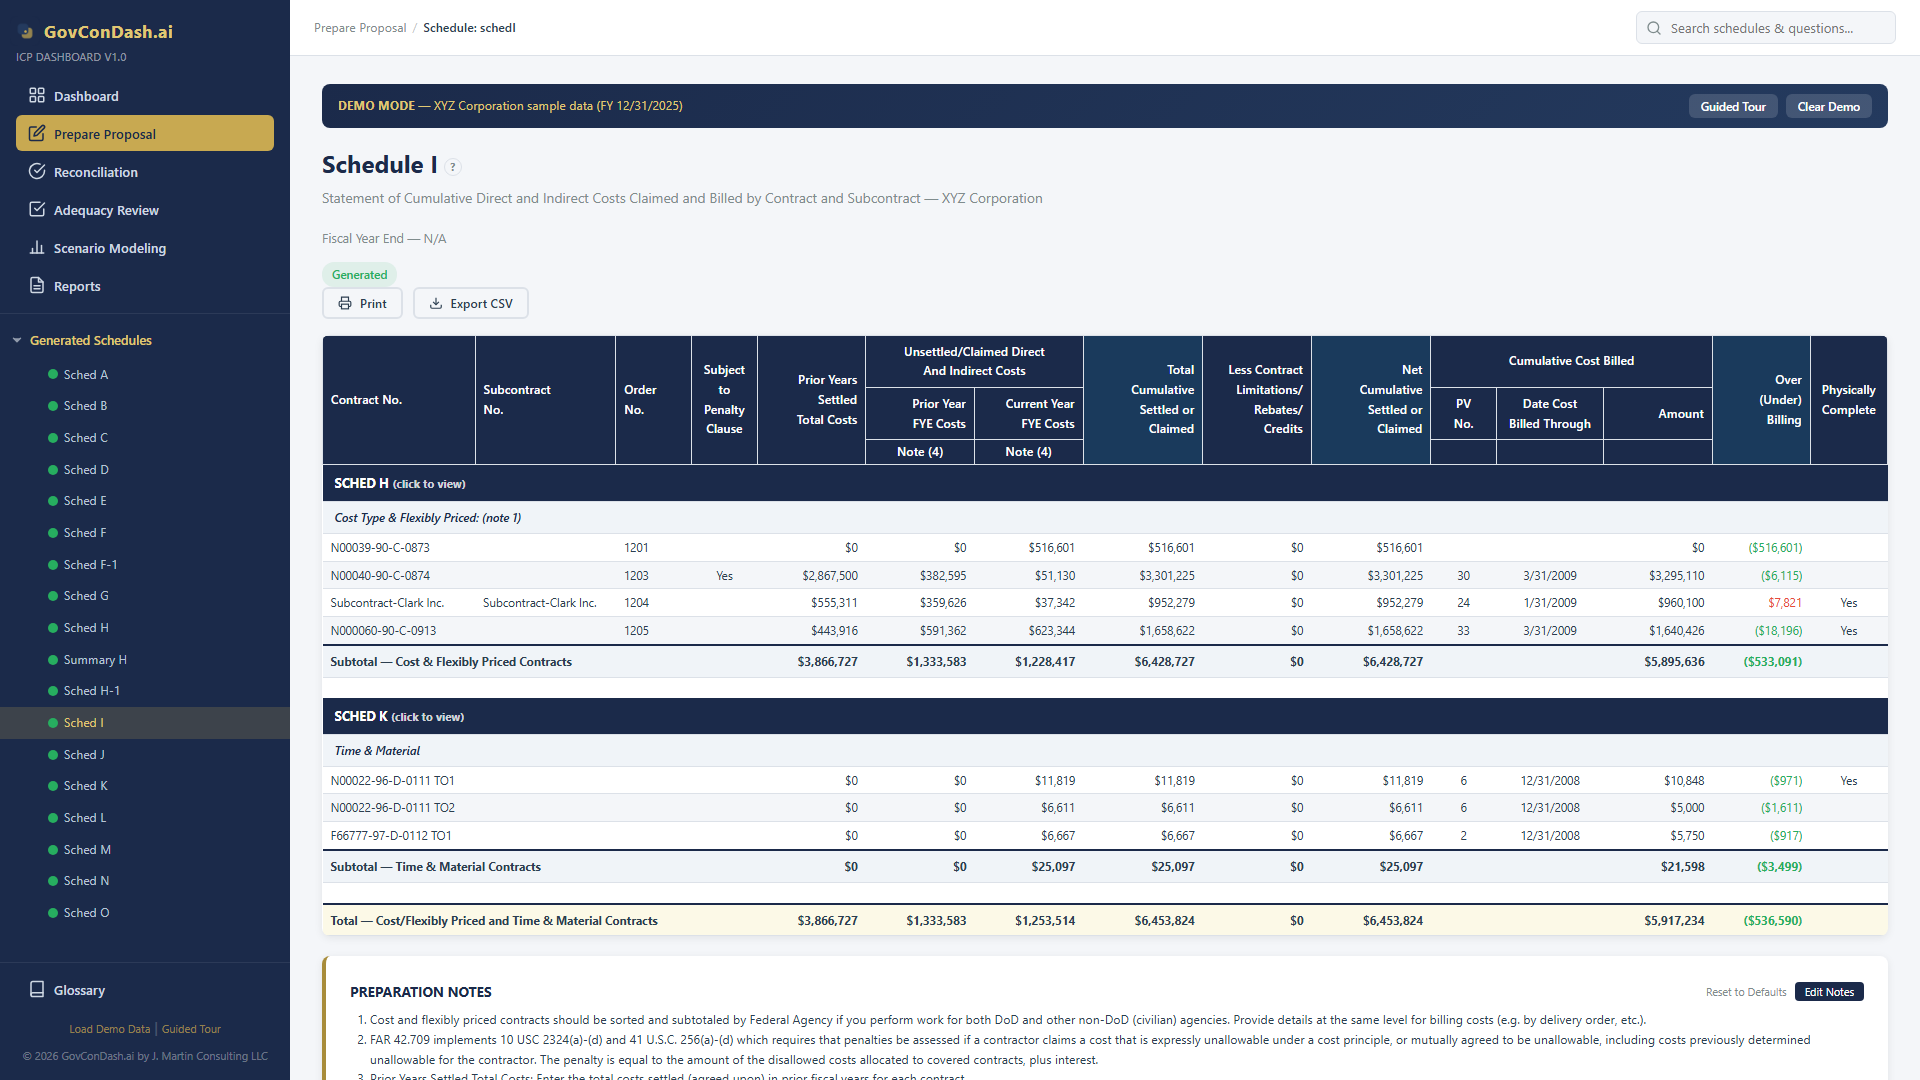
Enter your data once and the dashboard computes all ICE schedules (A through O) automatically via an 18-step computation pipeline.
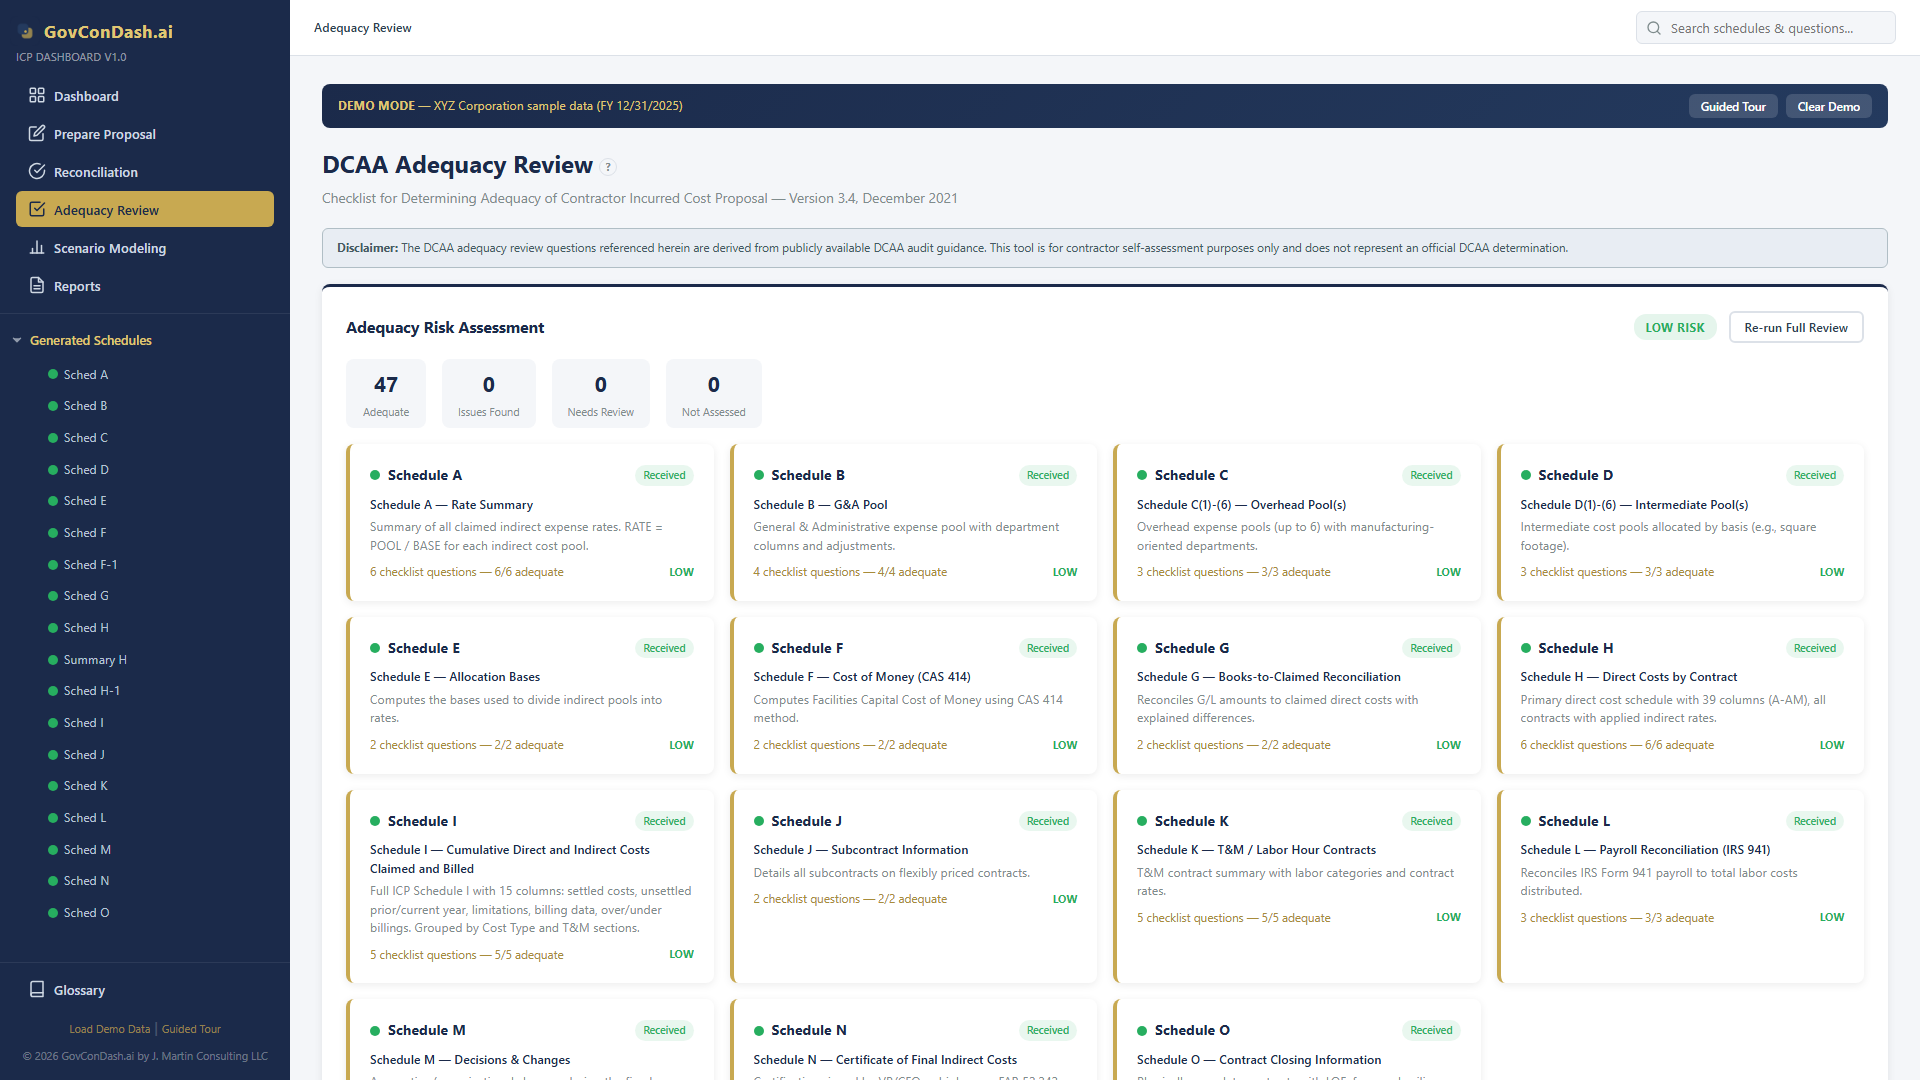
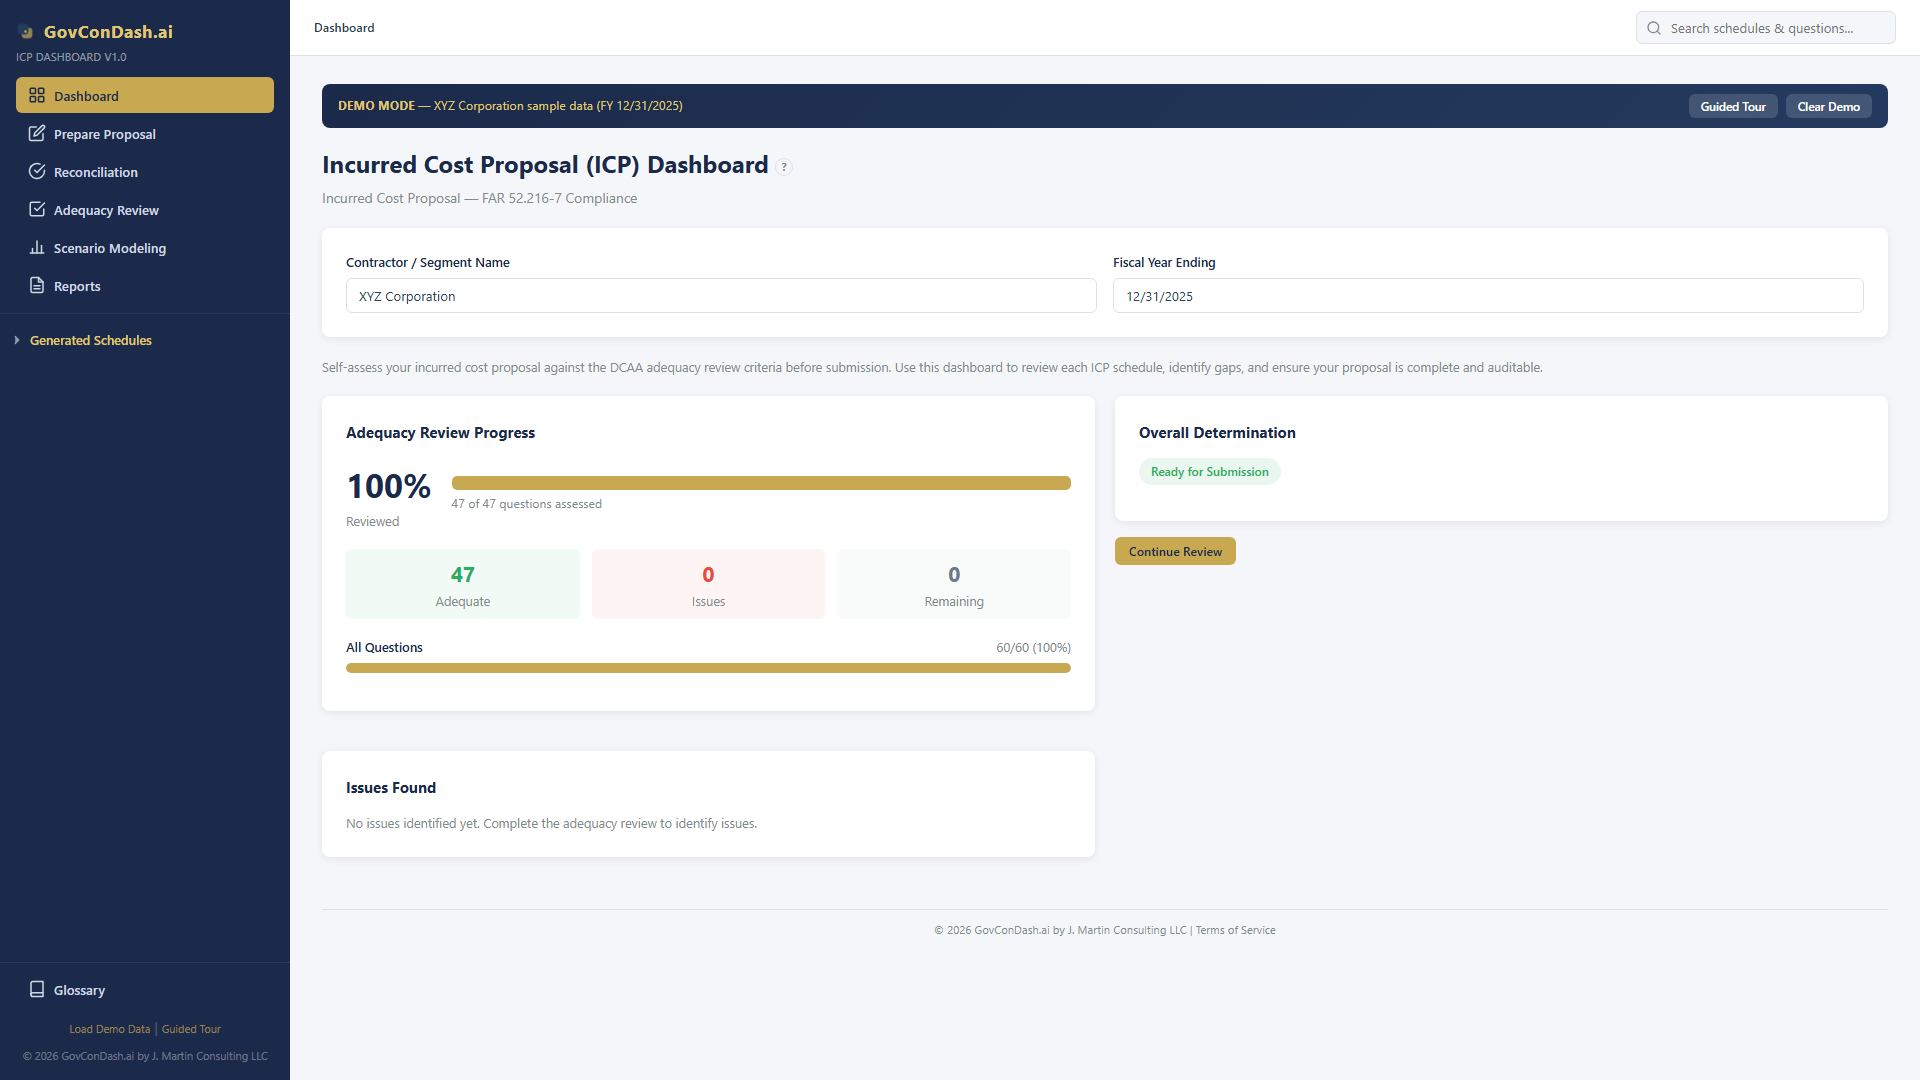
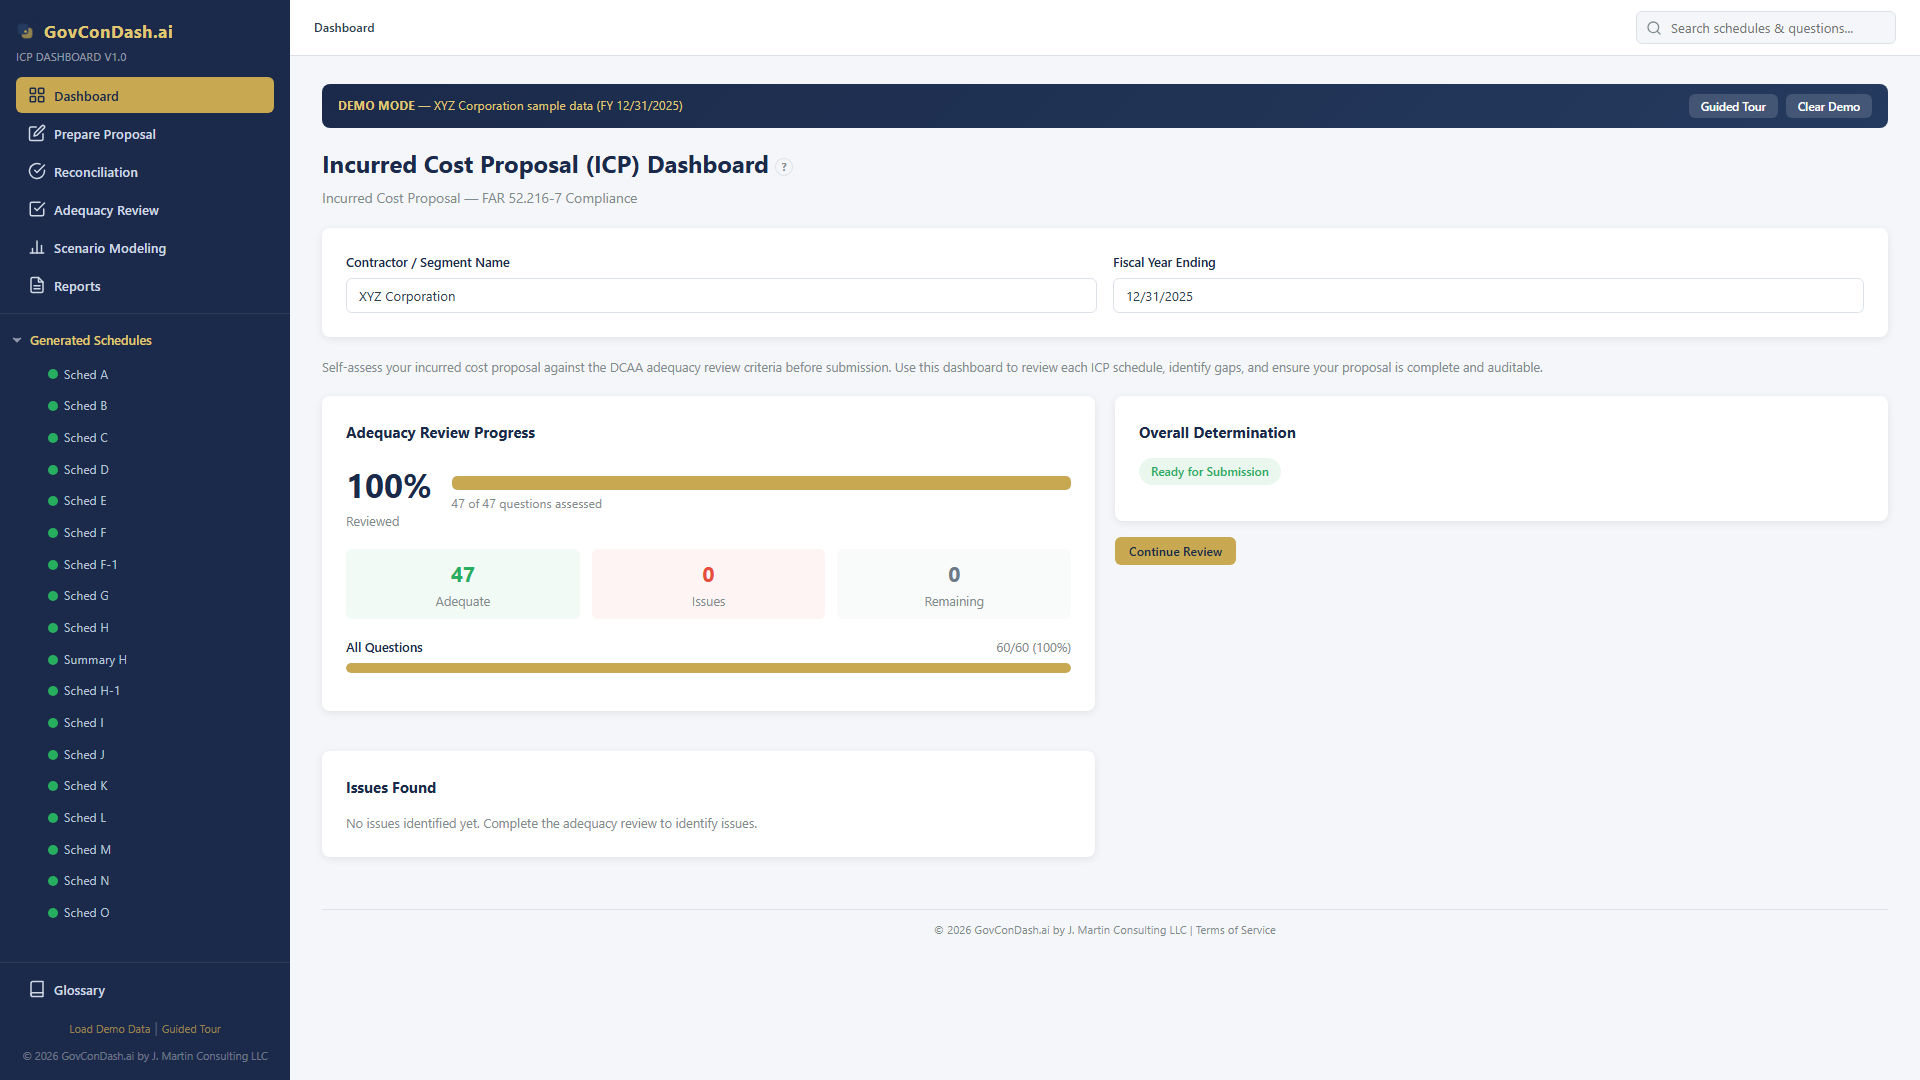
Complete 47-question DCAA Adequacy Checklist (v3.4) integrated with progress tracking, auto-population, and exportable reports.
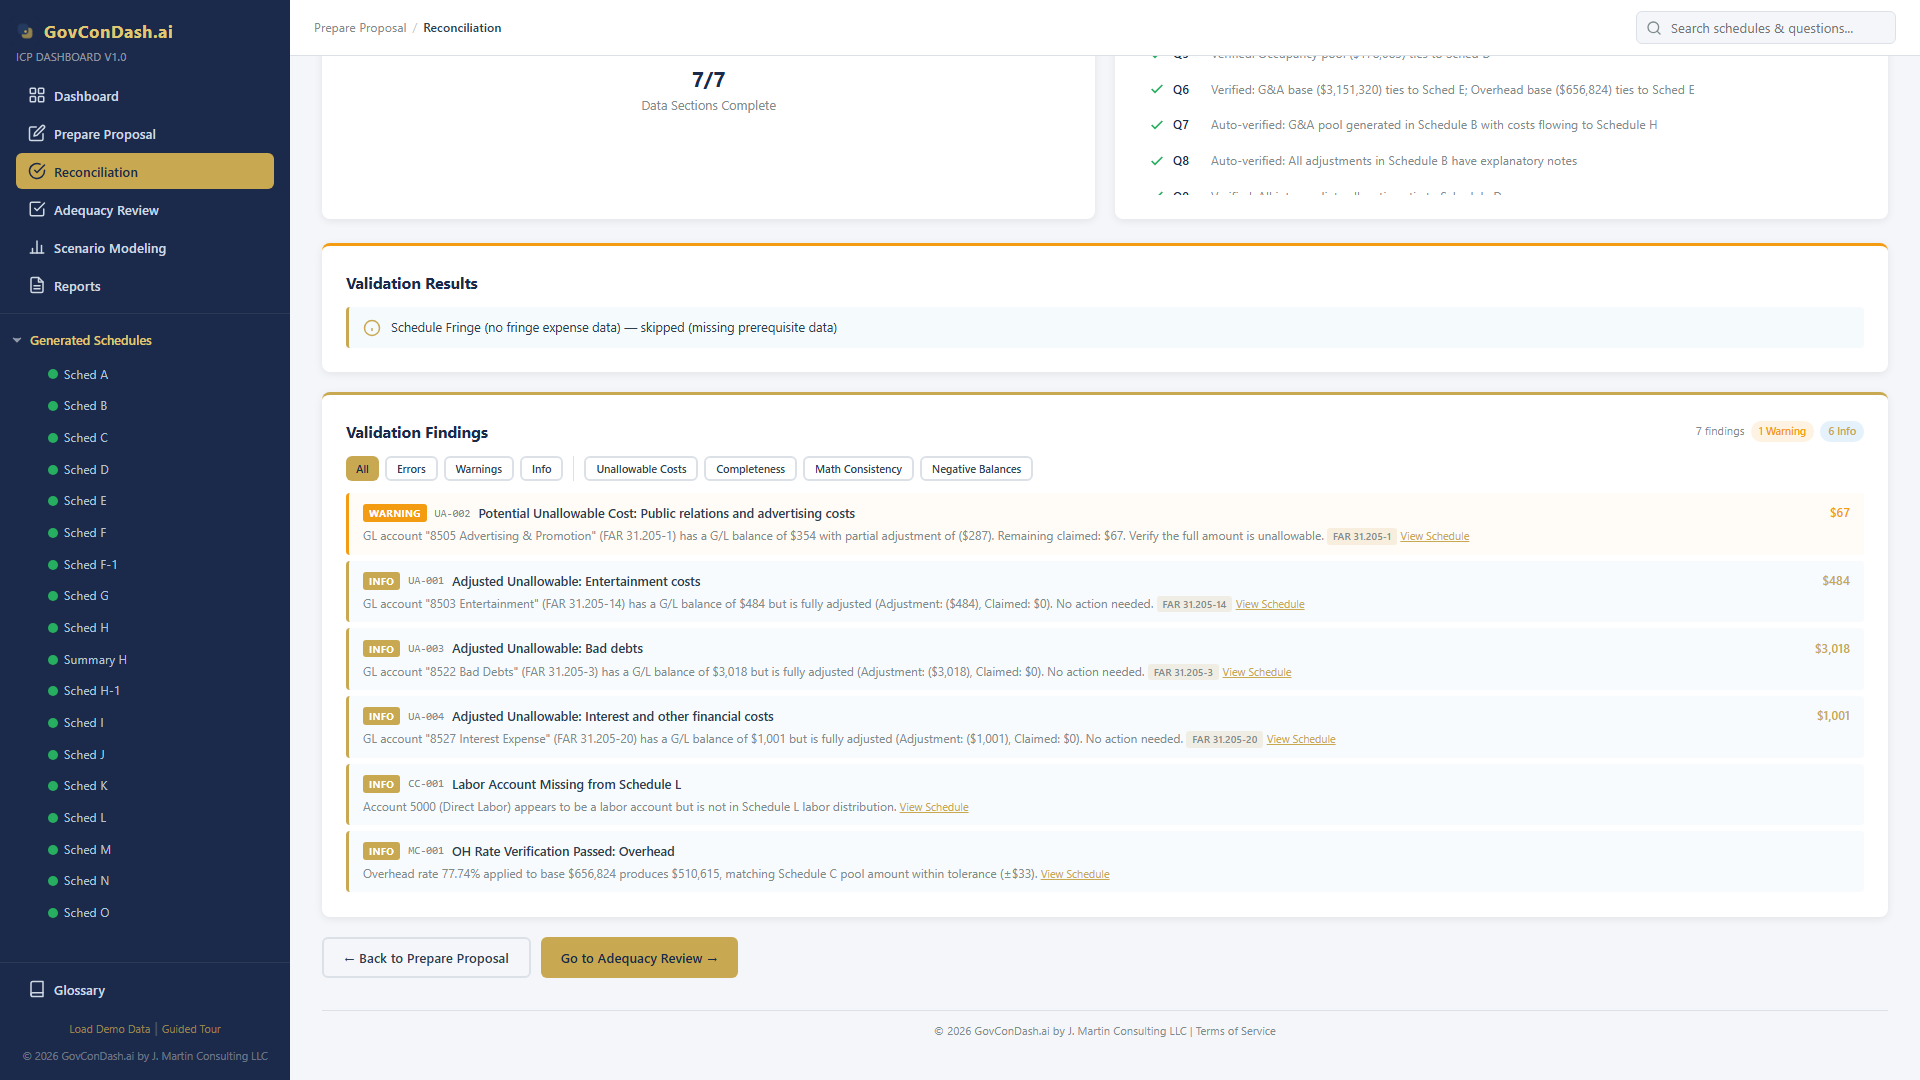
Automated detection of FAR 31.205 unallowable costs, math consistency checks, completeness audits, and negative balance flagging.
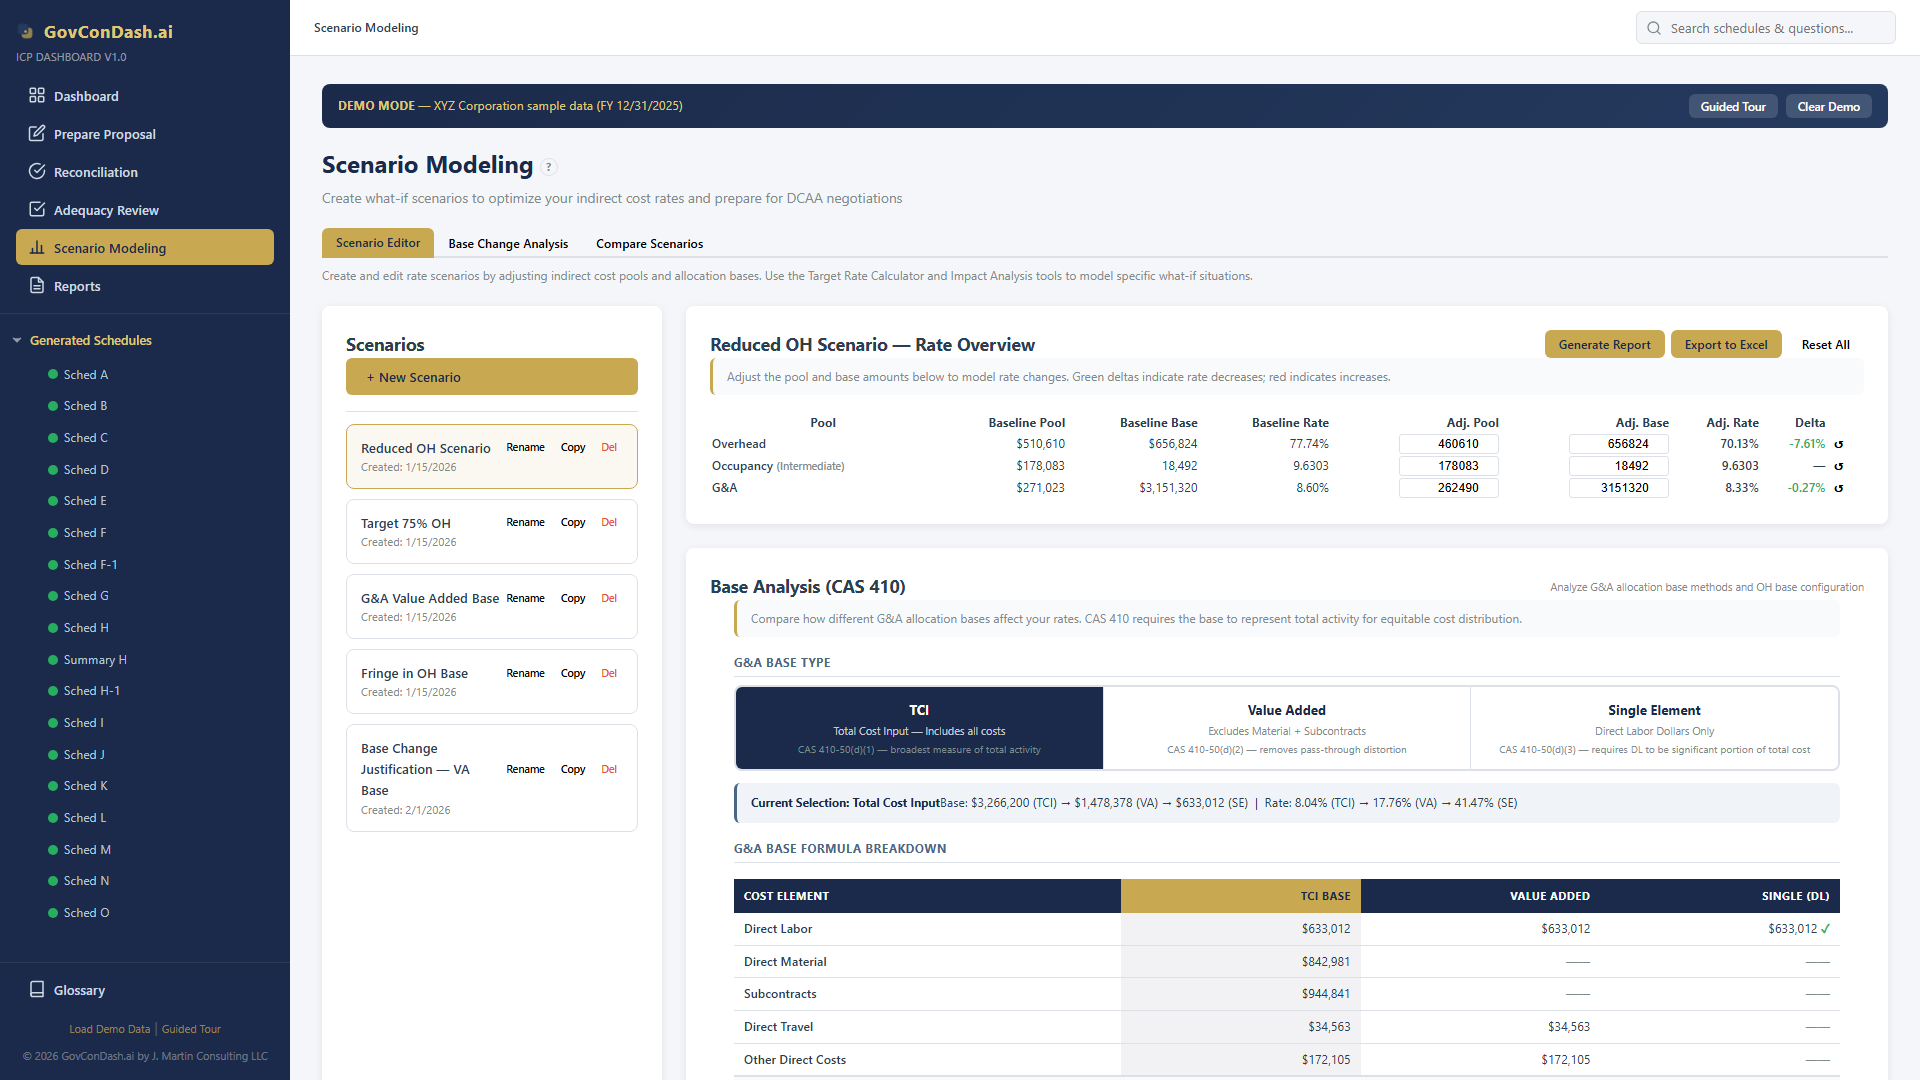
What-if rate analysis with CAS 410 base selection (TCI, Value Added, Single Element), target rate calculators, and side-by-side comparison.
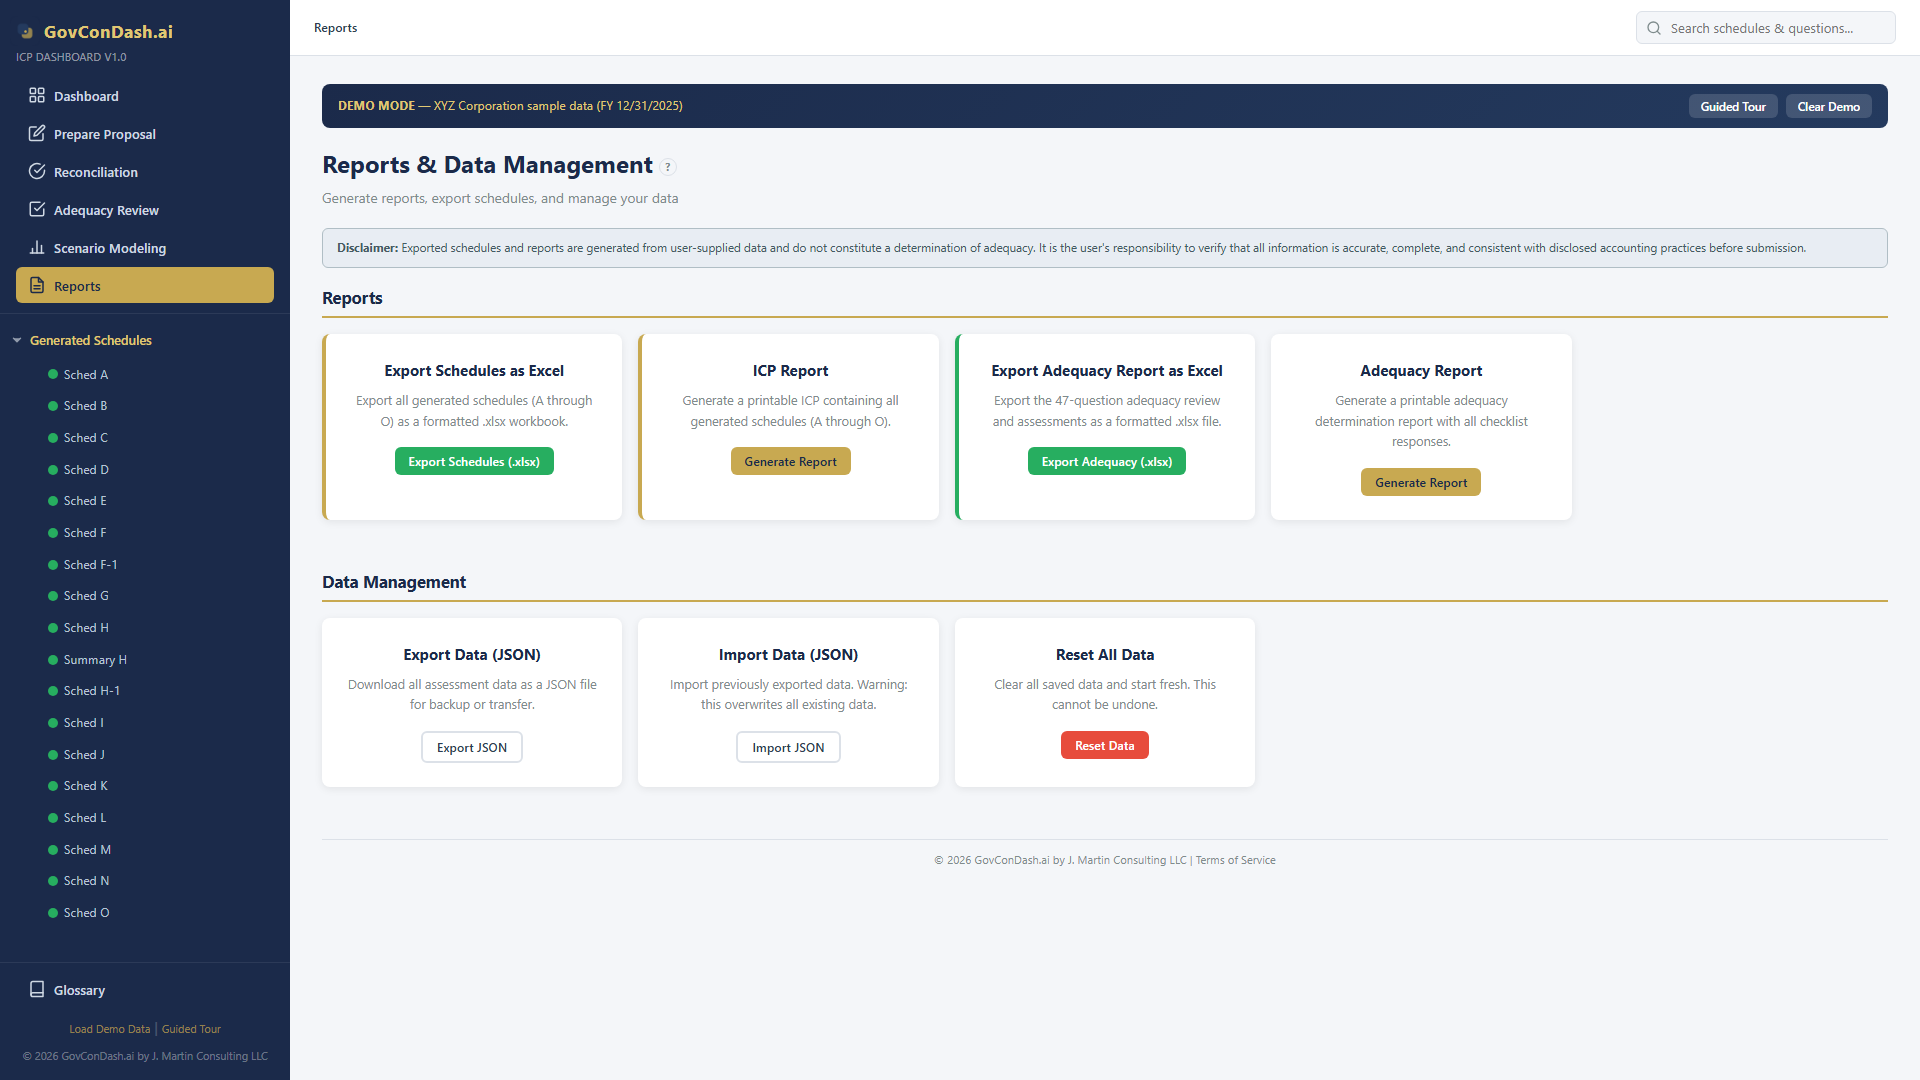
Full ICE Model auto-import from .xlsm files and multi-sheet Excel export with number formatting and cross-sheet formula references.
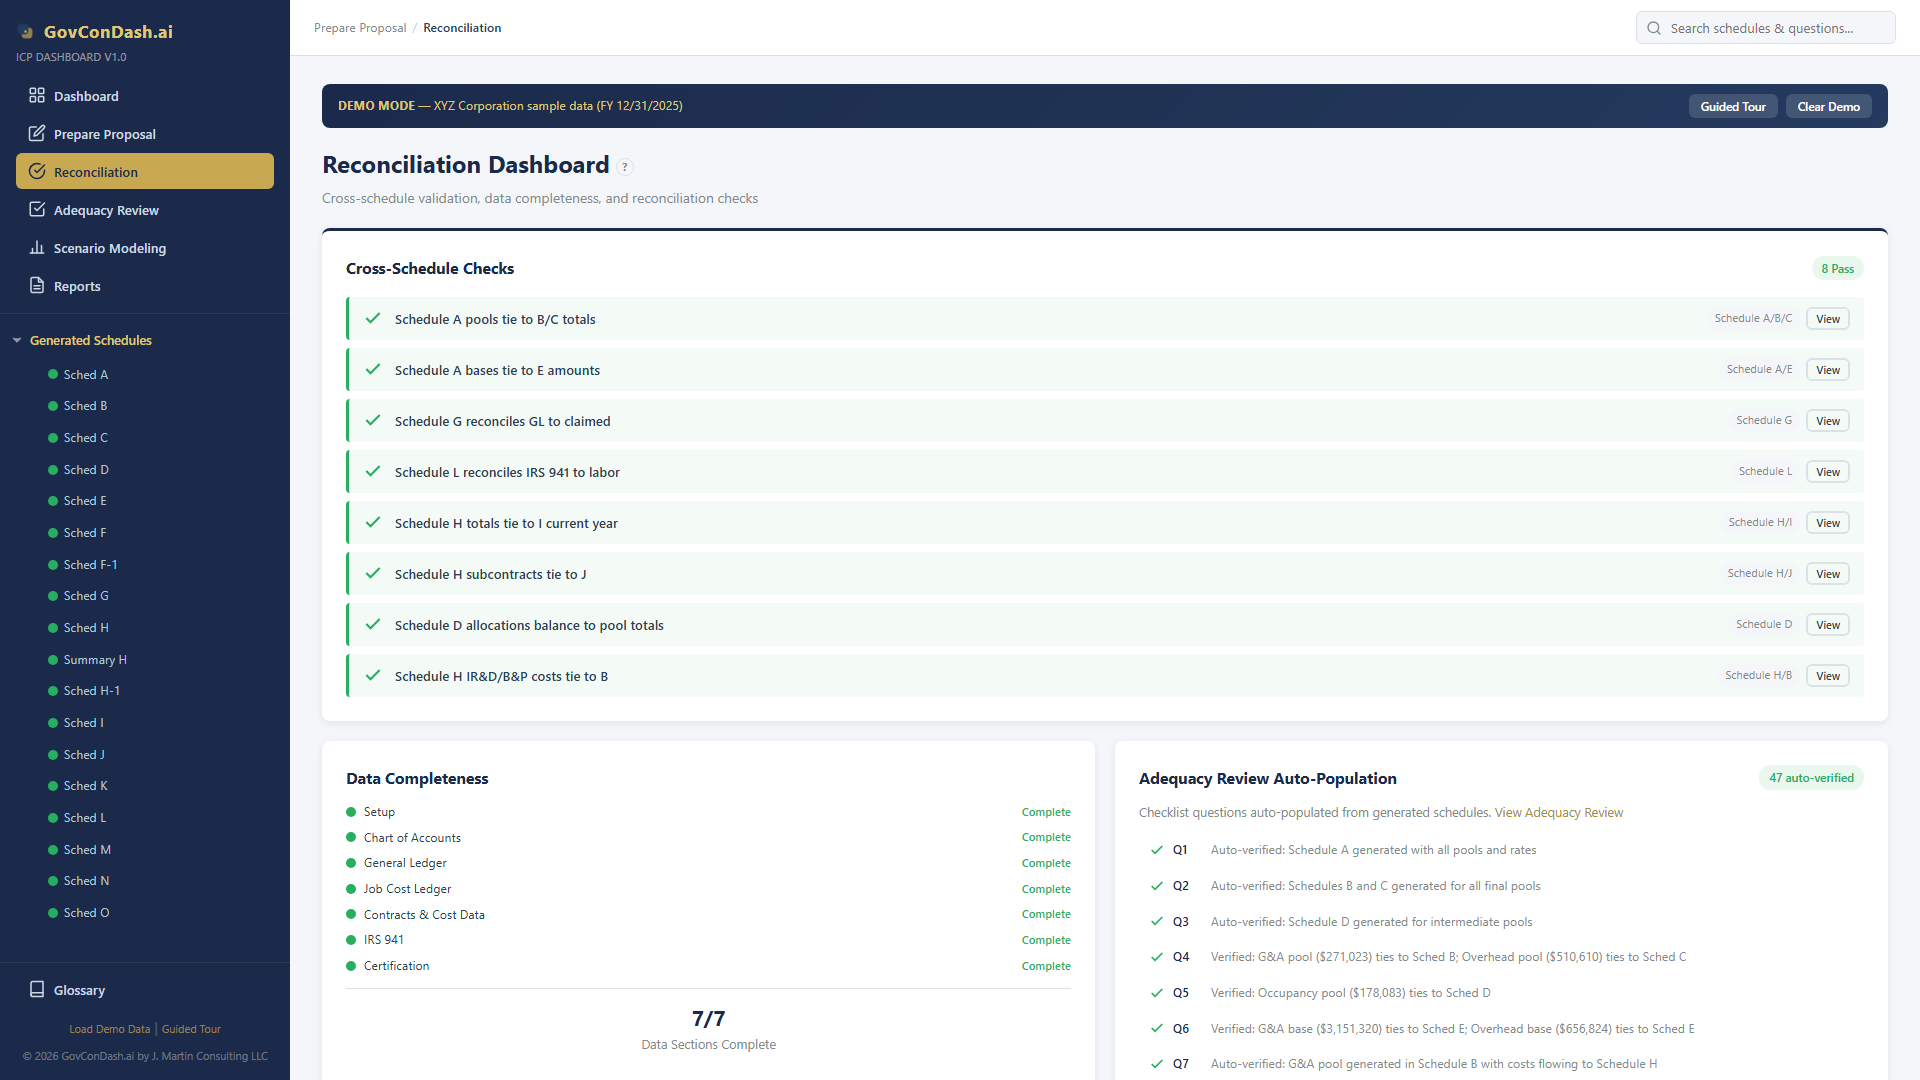
Real-time validation across all schedules with reconciliation checks that mirror DCAA audit procedures.

Four validation engines work together to ensure your proposal is complete and accurate before submission to DCAA.
The complete DCAA Adequacy Checklist (v3.4) with per-item assessment tracking, risk scoring, and automatic data population.
Create unlimited scenarios to model cost movements between pools, compare allocation bases, and justify base changes per CAS 410-50(d).
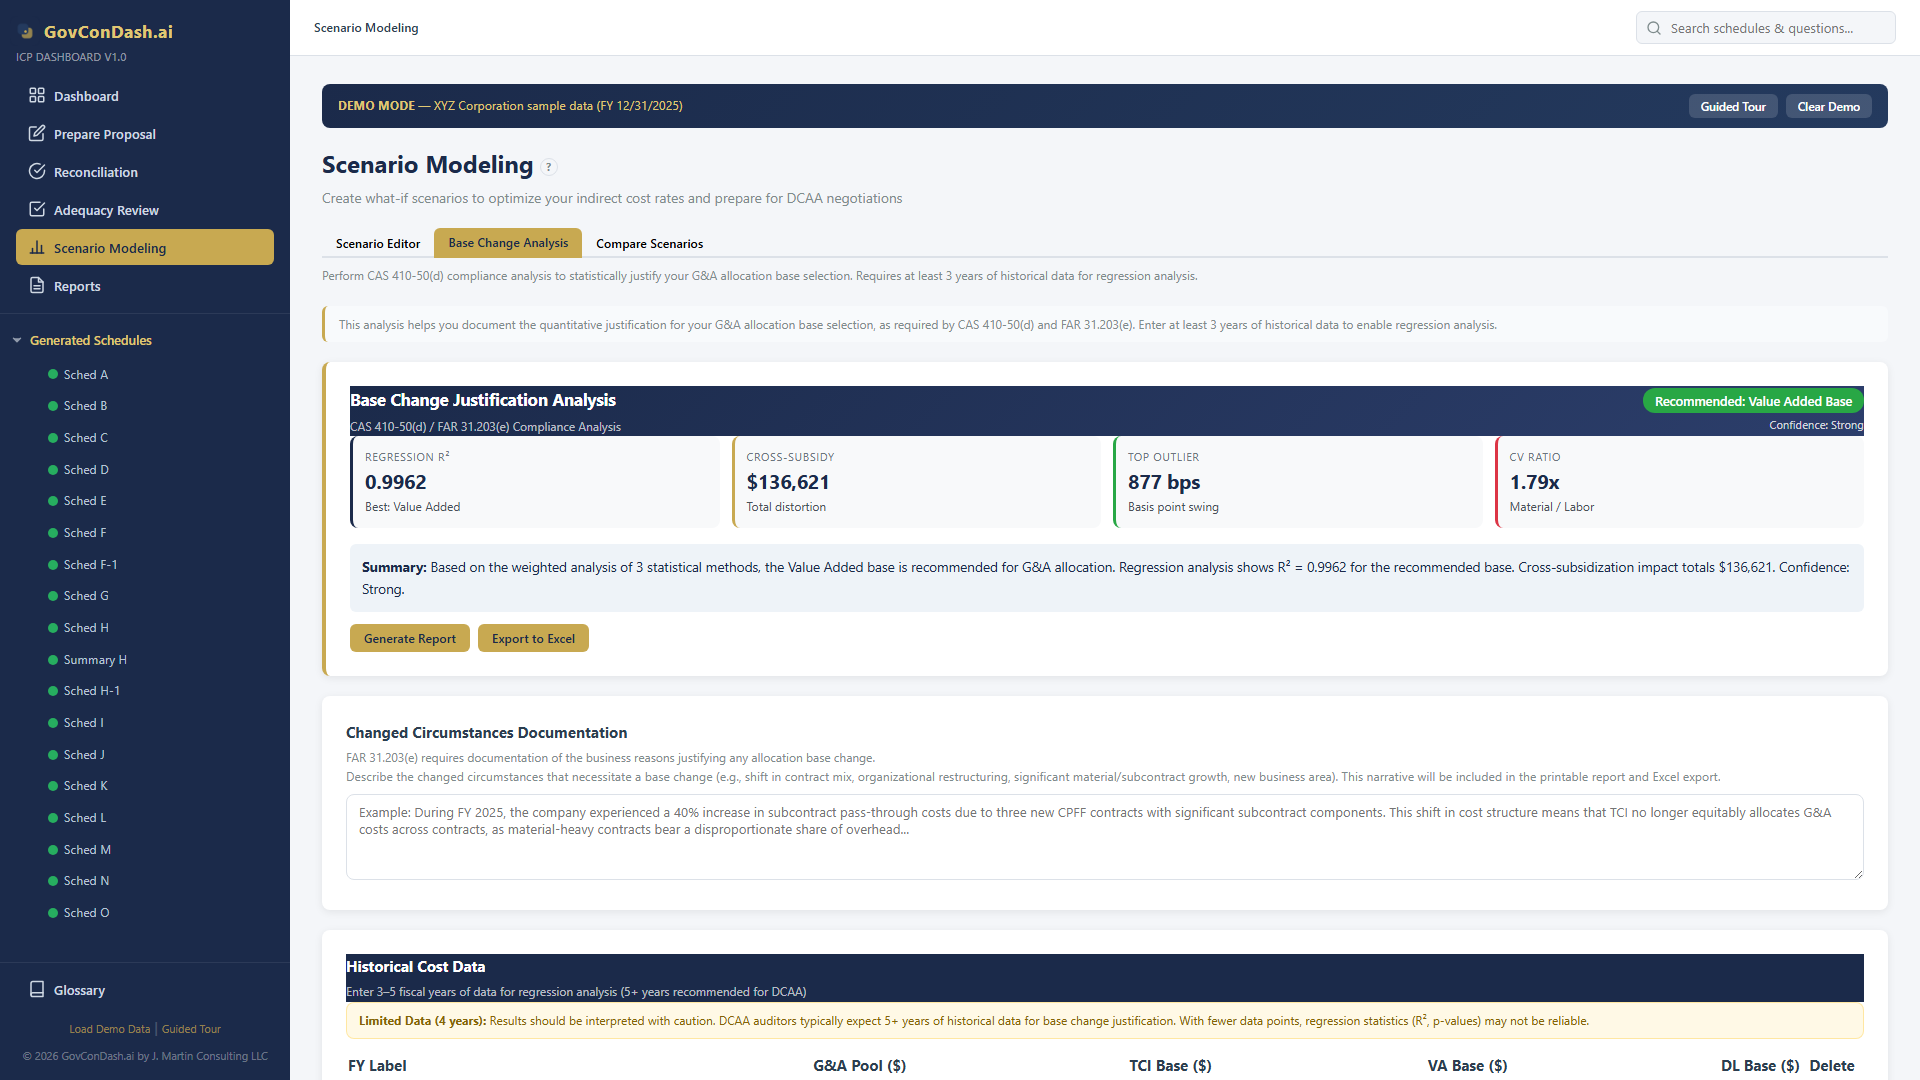
Full CAS 410-50(d) / FAR 31.203(e) compliance analysis with four statistical methods to support allocation base changes.
Two import paths cover every scenario — from existing ICE Model files to custom Excel exports from your accounting system.
Real-time reconciliation checks mirror DCAA audit procedures, ensuring all schedules are internally consistent.
The sidebar provides instant access to every schedule, checklist item, and tool. The home page shows key rate metrics and proposal status at a glance.
The XYZ Corporation demo (FY 12/31/2025) provides a complete, hands-on learning environment with realistic data.
Stop wrestling with complex spreadsheets. The ICP Dashboard gives your finance team the tools to prepare FAR-compliant incurred cost proposals with confidence.
GovConDash.ai