The G&A
Indirect Rate

How General & Administrative Costs Are Pooled, Allocated, and Applied Across Every Contract
G&A
Final Indirect Pool
What-If
Scenario Modeling
3
Allocation Bases
B & E
Key Schedules
01 — Fundamentals
What Is the G&A Rate?
The General & Administrative rate captures company-wide management and administrative expenses that benefit all contracts and business activities. Unlike overhead, which is tied to specific production functions, G&A covers the cost of running the entire organization.

Company-Wide Costs

G&A expenses include executive management, corporate accounting, legal, HR, business development, corporate rent, and other costs that benefit the business as a whole — not any single contract or project.

FAR 31.203 Governed

FAR 31.203 establishes the rules for indirect cost allocation. G&A must be allocated on a base that represents the total activity of the business. CAS 410 further governs base selection for CAS-covered contracts.

📈

Final Indirect Rate

G&A is the "outer layer" of indirect rates. It is applied after overhead and fringe have already been applied. The G&A rate is applied to the broadest base of all indirect pools.

💰

Applied to Every Contract

Unlike overhead, which may apply only to contracts with labor, G&A is applied to every contract type — cost-reimbursable, T&M, fixed-price, and commercial work.

Schedule B: The G&A Pool

All G&A expenses are accumulated on Schedule B of the ICP. This schedule lists every account classified as G&A, showing per-G/L amounts, adjustments, and the claimed total.

🔍

IR&D/B&P Flows In

Independent Research & Development and Bid & Proposal costs (with their applied overhead and fringe) flow into the G&A pool on Schedule B. This creates a dependency between Schedules A, E, H, and B.

02 — Pipeline
G&A Rate Computation Flow
The G&A rate is the ratio of the G&A pool (Schedule B) to the G&A allocation base (Schedule E). The base type — TCI, Value Added, or Single Element — determines what costs are included in the denominator.
📄

Schedule B

G&A expense accounts
+ IR&D/B&P costs
= G&A Pool (numerator)

÷
📊

Schedule E

G&A allocation base
TCI, Value Added,
or Single Element

=
💰

G&A Rate

Expressed as %
rounded to 4 decimals
(e.g., 8.60%)

📝

Schedule H

Applied to each
contract's share
of the base

Pool = Schedule B

All G&A accounts from the chart of accounts, plus IR&D/B&P direct costs and their applied overhead and fringe. Adjustments for unallowable costs are netted here.

📈
Base = Schedule E

The allocation base aggregates costs from Summary Schedule H. The base type (TCI vs. Value Added vs. Single Element) determines which cost elements are included.

📊
Rate = Pool / Base

The G&A rate is computed to 4 decimal places as a percentage. This rate appears on Schedule A and is applied to every contract on Schedule H.

03 — Schedule B
The G&A Cost Pool
Schedule B is where all G&A expenses are accumulated. It includes every account classified as G&A in the chart of accounts, plus the IR&D/B&P costs that flow in from Schedule H.

What Goes Into the G&A Pool

The G&A pool captures all management and administrative costs that cannot be directly charged to contracts or assigned to a specific overhead pool. These are the costs of running the business itself.

  • Executive Compensation — CEO, CFO, and executive management salaries and benefits
  • Corporate Functions — Accounting, HR, legal, IT support, corporate rent, insurance
  • Business Development — Marketing, proposal costs (non-B&P), trade shows, memberships
  • IR&D/B&P — Direct costs plus applied OH and fringe flow from Schedule H into the G&A pool
  • Adjustments — Unallowable costs (entertainment, lobbying, fines) are removed via adjustments
Schedule B G&A pool
Schedule B: G&A cost pool with per-G/L amounts, adjustments, and claimed totals
04 — Schedule E
The G&A Allocation Base
Schedule E computes the denominator of the G&A rate. The base must represent the total activity of the business per FAR 31.203. Three base types are available, each including different cost elements.

How the Base Is Built

The G&A base is assembled from Schedule H (Summary H) by summing cost elements across all contract sections. The base type determines which elements are included or excluded.

  • Direct Costs — Labor, material, subcontracts, travel, and other direct costs from all contracts
  • Applied Overhead — OH amounts applied to each contract (included in TCI and Value Added bases)
  • Applied Fringe — Fringe benefit amounts if carried as a separate rate
  • Intermediate Pools — Occupancy, service centers, and other allocated intermediate costs
  • Exclusions — Value Added base excludes direct material and subcontracts from the denominator
Schedule E allocation bases
Schedule E: G&A allocation base with cost element breakdown
05 — Formulas
G&A Rate Formulas
The core G&A computation is straightforward — pool divided by base — but the base calculation varies significantly depending on the allocation method chosen.
G&A Rate = Pool / Base

Core Rate Formula

The G&A pool (Schedule B grand total) divided by the G&A base (Schedule E), rounded to 4 decimal places and expressed as a percentage.

4-Decimal Precision
TCI = Direct + OH + Fringe + Intm

Total Cost Input Base

The most inclusive base. Sums all direct costs, applied overhead, applied fringe, and intermediate pool allocations across all contracts. The broadest denominator.

Most Common
VA = TCI - Material - Sub

Value Added Base

Starts with TCI, then removes direct material and subcontract costs. Prevents high-material contracts from absorbing a disproportionate share of G&A. Governed by CAS 410.

CAS 410 Option
SE = Direct Labor

Single Element Base

Uses only direct labor as the allocation base. The narrowest denominator, producing the highest G&A rate. Only appropriate when labor is the predominant cost driver.

Narrow Base
Contract G&A = Base × Rate

Application on Schedule H

Each contract's share of the allocation base is multiplied by the G&A rate. The result appears as "Applied G&A" on Schedule H for every contract.

Per Contract
Pool += IR&D/B&P

IR&D/B&P Feedback

IR&D and B&P costs (direct + applied OH + fringe) flow back into the G&A pool on Schedule B. G&A is not applied to IR&D/B&P themselves to avoid circular double-counting.

Circular Resolution
06 — Base Selection
TCI vs Value Added
Choosing the right G&A allocation base is one of the most impactful decisions in an ICP. The base type affects every contract's G&A allocation and can shift tens of thousands of dollars between contracts.

When to Use Each Base

CAS 410 requires the G&A base to represent the total activity of the business. When material and subcontract costs are a large, variable portion of direct costs, Value Added may better represent the contractor's own productive activity.

  • TCI — Best when material and subcontracts are a consistent, moderate portion of costs across all contracts. The simplest and most commonly accepted base.
  • Value Added — Best when one or two contracts have disproportionately large material or subcontract costs that would otherwise absorb excessive G&A.
  • Single Element — Rarely used. Only when direct labor is the overwhelmingly dominant cost element (typically over 85% of direct costs).
  • CAS 410-50(d) Test — Changing your base requires justification: statistical analysis, distortion testing, and demonstration that the new base better represents total activity.
Scenario modeling base analysis
Base analysis comparing TCI, Value Added, and Single Element G&A rates
07 — Scenario Modeling
What-If Analysis for G&A Rates
The ICP Dashboard includes a full scenario modeling suite that lets you explore how changes to the G&A pool, allocation base, and cost structure affect your rate — before you commit to anything on your ICP.

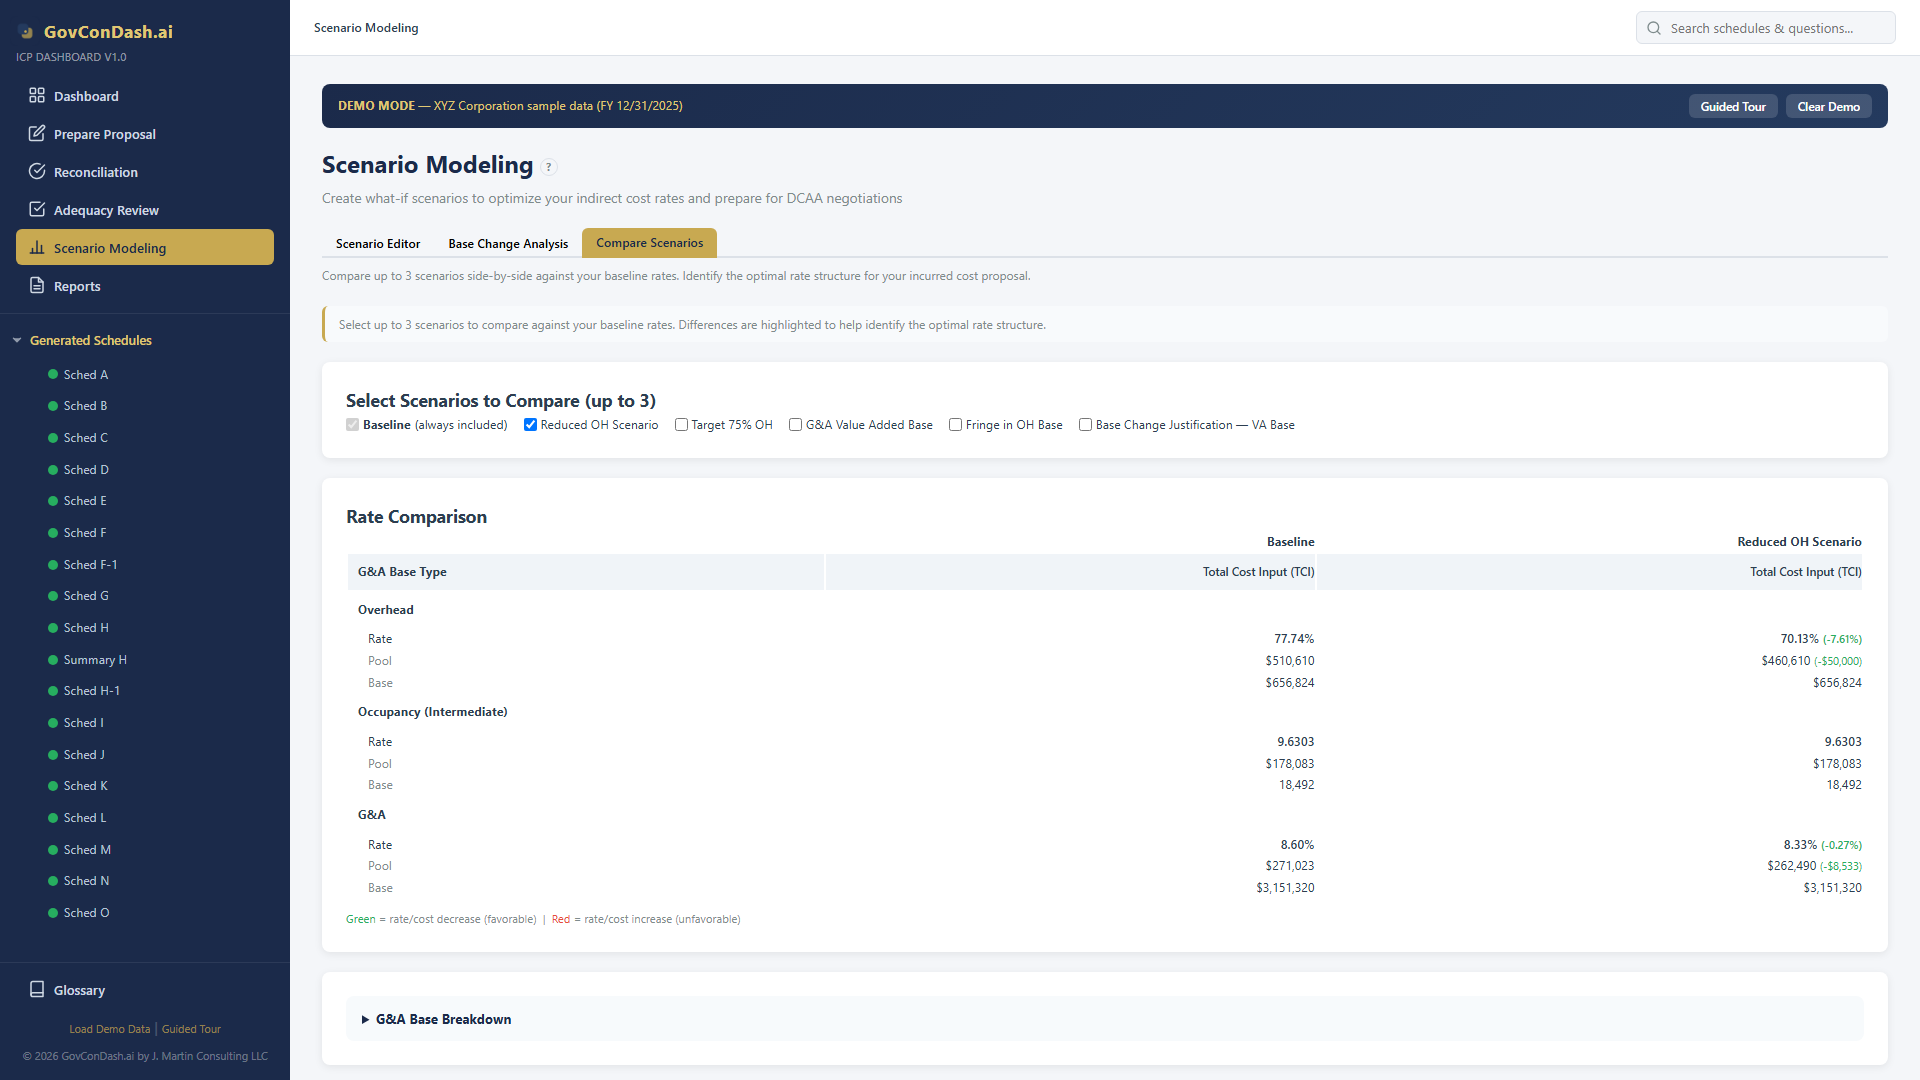
Side-by-Side Rate Comparison

Create up to three scenarios and compare them against your baseline. Each scenario can use a different G&A base type, pool adjustments, or cost reclassifications — and instantly see the impact on every rate.

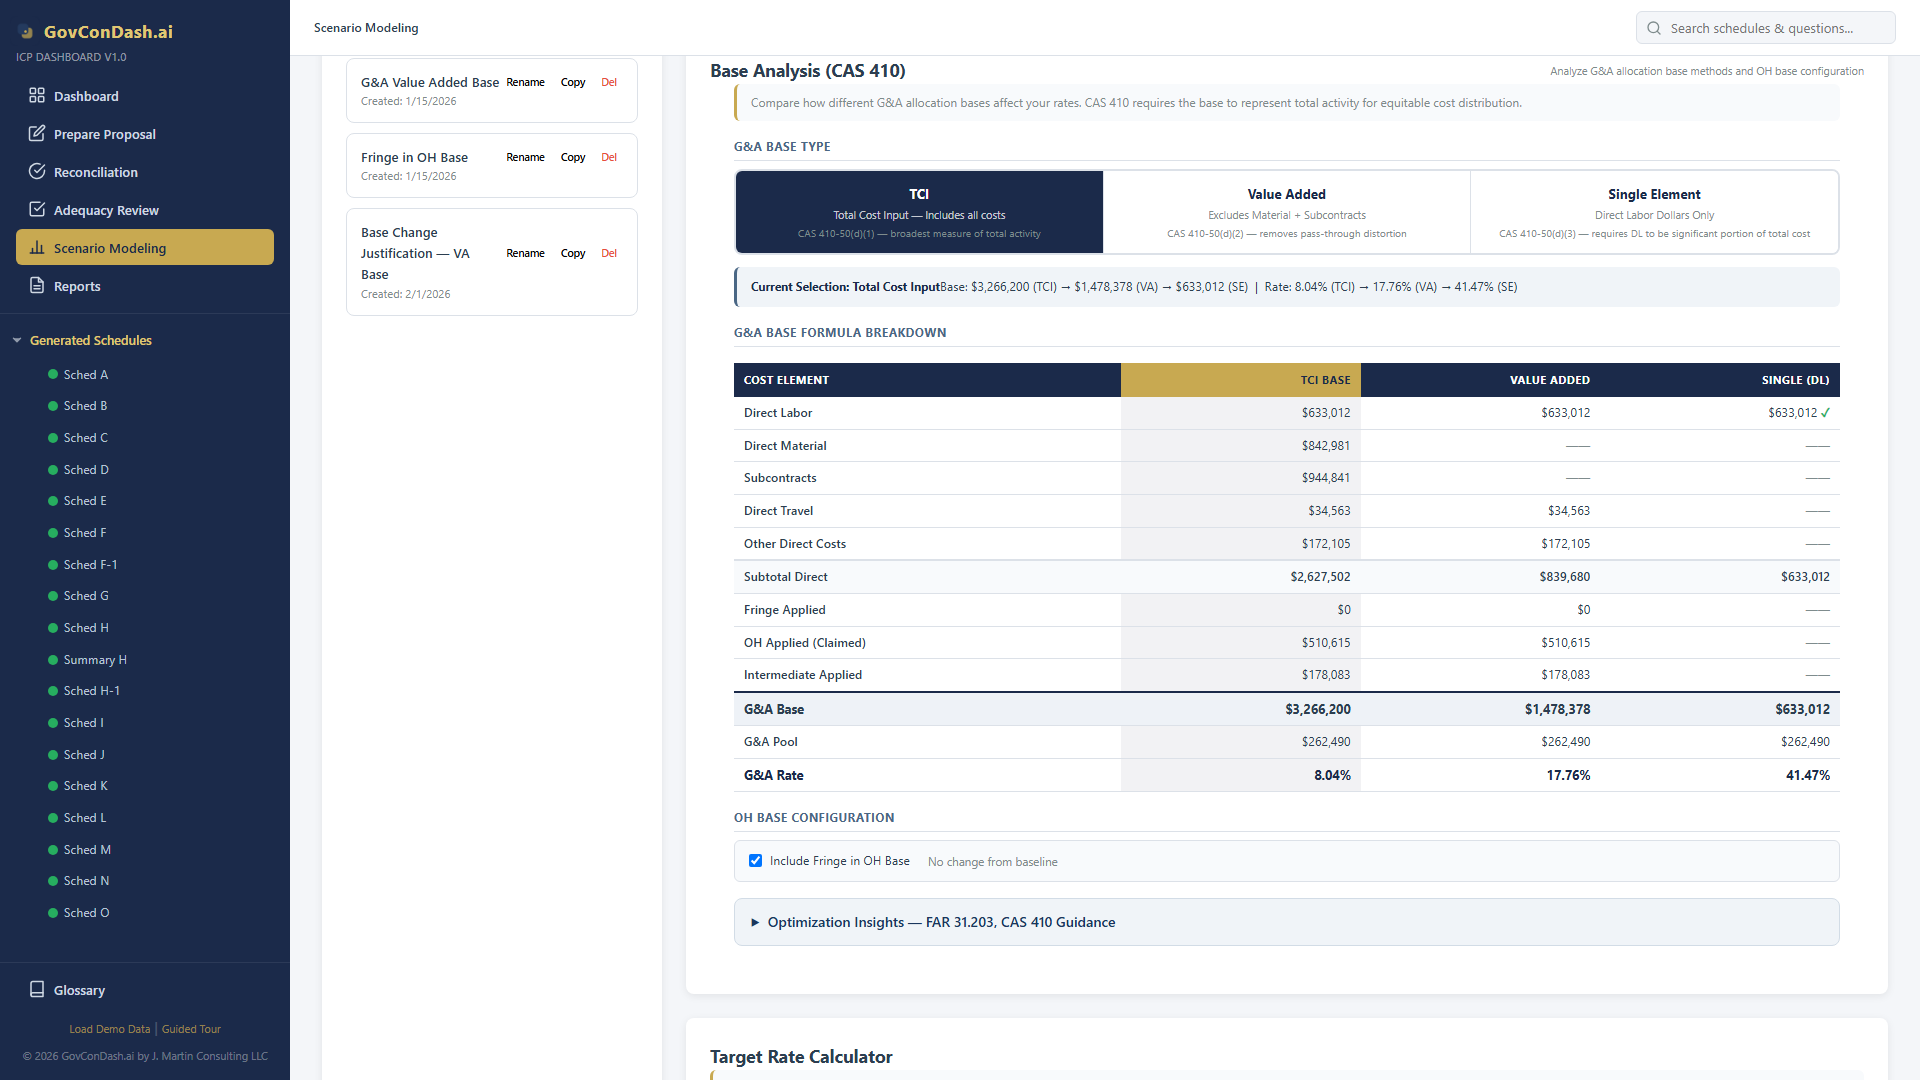
  • Base Type Toggle — Switch a scenario between TCI, Value Added, and Single Element to see how the G&A rate changes under each allocation method
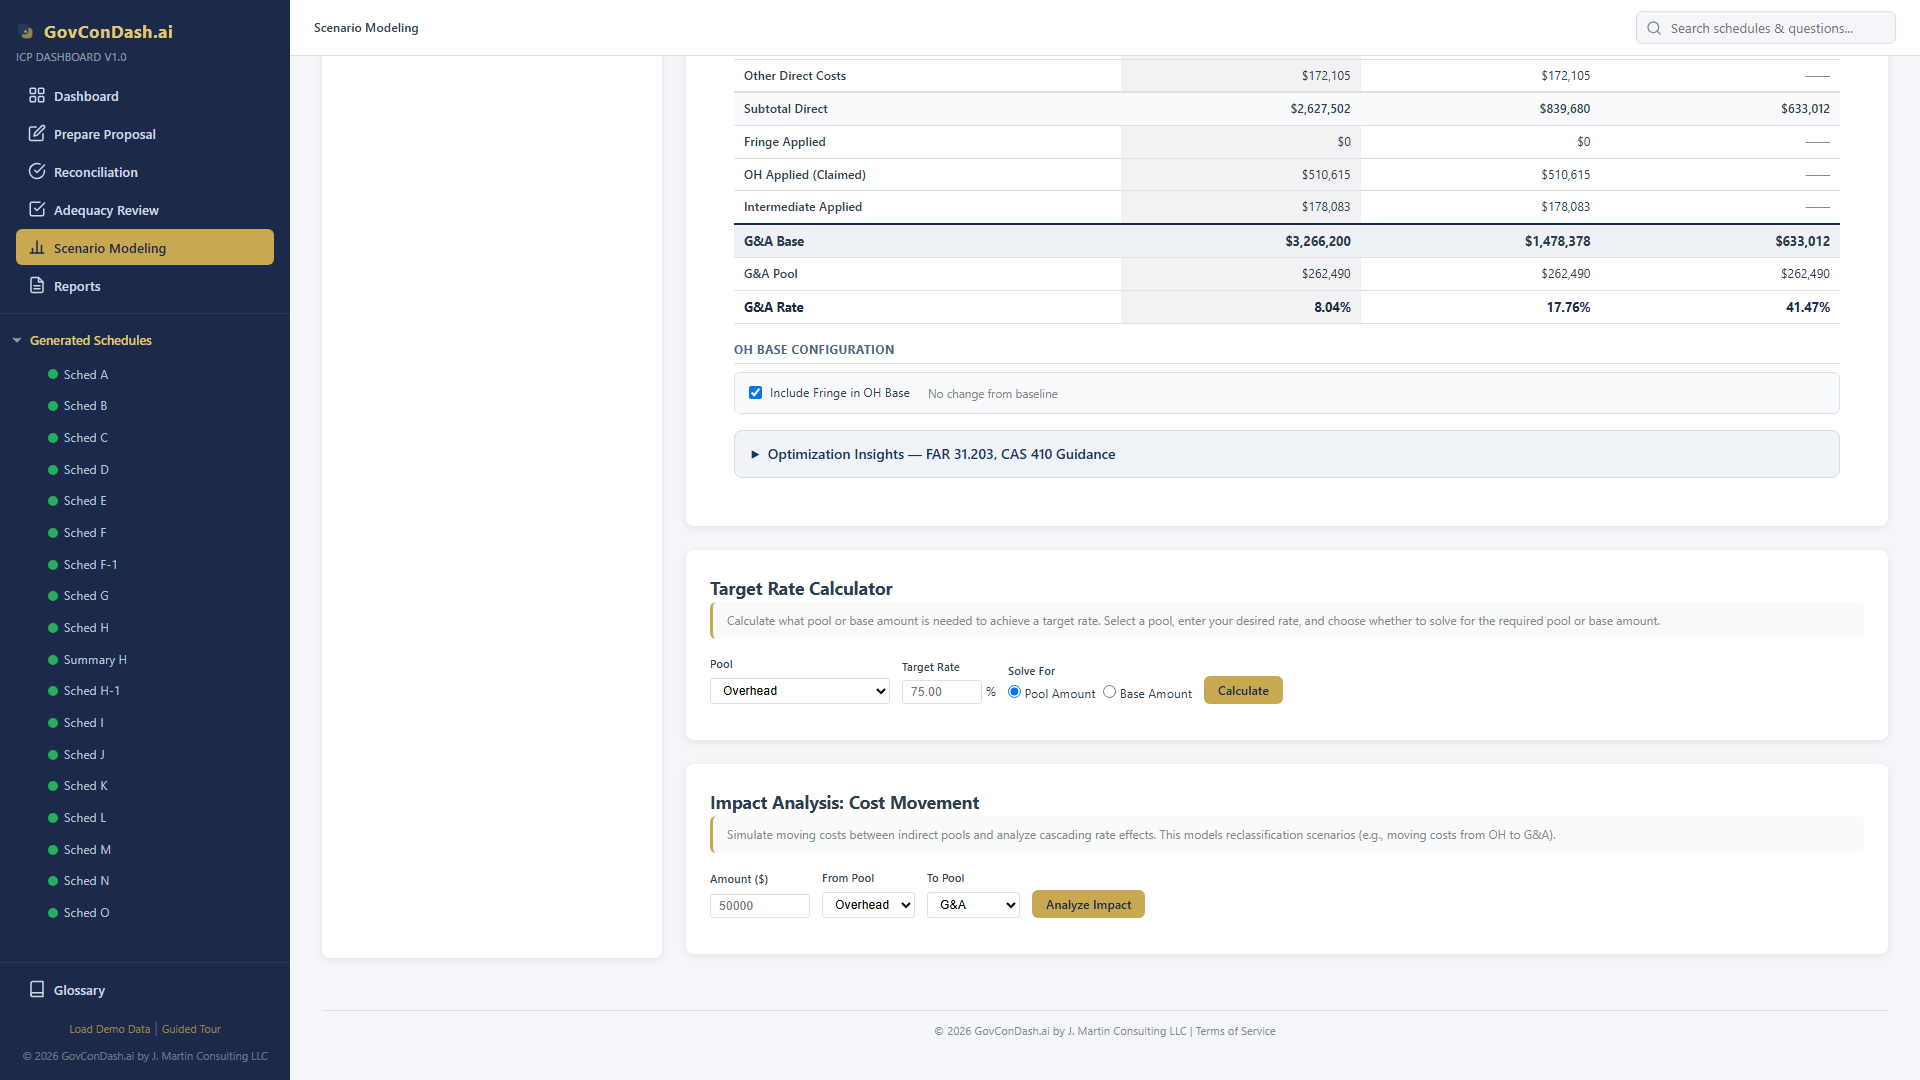
  • Pool Adjustments — Move costs between OH and G&A pools and see cascading rate effects in real time
  • Delta Highlighting — Rate increases and decreases are color-coded so you can spot the impact at a glance
  • Contract-Level Preview — See how G&A allocation shifts across individual contracts under each scenario
Scenario comparison view
Side-by-side comparison of three G&A rate scenarios against baseline
07 — Scenario Modeling (cont.)
Calculators & Justification

Target Rate Calculator

Working backwards from a target G&A rate is a common need during negotiations and rate planning. The target rate calculator reverse-solves the formula to tell you exactly what pool or base is required.

  • Solve for Pool — Enter your target rate and current base, and the calculator computes the maximum pool amount to hit that rate
  • Solve for Base — Enter your target rate and current pool, and the calculator computes the minimum base required
  • One-Click Apply — Apply the calculated result directly to the scenario and see the full downstream impact
Target rate calculator
Reverse-solve for the pool or base needed to achieve a target G&A rate

Base Change Justification

If scenario modeling reveals that a different base type produces a fairer allocation, the dashboard provides the CAS 410-50(d) justification analysis you need to support the change.

  • OLS Regression — Multi-year regression analysis across TCI, Value Added, and Direct Labor bases with R², p-values, and confidence intervals
  • Rate Impact Analysis — Contract-by-contract comparison of G&A allocations under each base type, with cross-subsidization detection
  • Sensitivity Analysis — Material/subcontract concentration metrics, Herfindahl index, and rate stability ranking
  • Exportable Report — Print-ready CAS 410 justification report with all statistical evidence and regulatory citations
Regression scatter plots
OLS regression analysis with scatter plots for base change justification
08 — Common Mistakes
G&A Rate Pitfalls
The G&A rate is the most scrutinized indirect rate in a DCAA audit. These common mistakes lead to adequacy failures, questioned costs, and rate adjustments.

Unallowable Costs in the Pool

Entertainment, alcohol, lobbying, fines, and other FAR 31.205 unallowable costs left in the G&A pool inflate the rate. Every unallowable dollar must be adjusted out.

Mismatched Pool and Base

The G&A base must include costs from all business segments that benefit from G&A. Excluding commercial work from the base while including G&A costs that support it creates an inflated rate.

Applying G&A to IR&D/B&P

IR&D/B&P costs flow into the G&A pool — they are part of the pool, not the base. Applying G&A on top of IR&D/B&P double-counts these costs and creates a circular error.

Changing Base Without Justification

Switching from TCI to Value Added (or vice versa) requires CAS 410-50(d) justification: statistical analysis, distortion testing, and a formal disclosure statement change.

Excluding Intermediate Pool Costs

If you use a TCI base, intermediate pool allocations (occupancy, service centers) must be included in the base. Omitting them understates the base and inflates the G&A rate.

Wrong Rounding Precision

G&A rates must be rounded to 4 decimal places (e.g., 8.6023%). Using fewer decimals or full floating-point values creates reconciliation mismatches with DCAA.

Missing Contract Sections on Schedule H

All contract types must appear on Schedule H for the G&A base to be complete. Omitting fixed-price or commercial sections understates the base and overstates the rate charged to cost-type contracts.

Not Reconciling B to E to A

Schedule B (pool) divided by Schedule E (base) must equal Schedule A (rate). A $1+ variance between these schedules triggers an automatic DCAA adequacy failure.

Master Your G&A Rate

The ICP Dashboard automates G&A pool accumulation, base computation, rate calculation, and cross-schedule reconciliation — with built-in CAS 410 base analysis and what-if scenario modeling.

GovConDash.ai